Data Analysis Expression or DAX in short is a formula expression language which is used by the Analysis Engine of Microsoft. It is used by many Microsoft products including Power Pivot.
So today we will get an introduction on how we can use DAX to create custom calculated
columns & measures within Power Pivot, so that we can use it in our pivot tables. Let’s go!

This will be in continuation to my previous content & will be using the same data and built upon the pivot we already created. In case you have not gone through my earlier content then please do the same before continuing.
Requirement
We have 2 tables, one for Sales & another for Profit.
After Importing both the dataset into Power Pivot, create a measure in the Profit table to get the Profit% against the sales figures.
Create a calculated Column in the Profit table to get 2 characters from left from the Customer ID column. Then use that column
Dataset Used
https://docs.google.com/spreadsheets/d/1dSc0XivD7W91Zi6EKCh-payKlU3NyGou1rkSTl7wxqA/edit?usp=sharing
Now if you are wondering that this can be done using Calculated Field & Items in pivot table itself then no, because both of these options are disabled when we create the pivot using Data Model. So we will have to accomplish this using calculated measures & columns.
Now assuming you have already gone through my earlier content & imported the data into the Power Pivot. Let fire up the Power Pivot editor by clicking on Manage in the Power Pivot tab

Creating your first DAX in Power Pivot
For completing the first requirement, we will create a measure in power pivot.
If you see in the screenshot, we can enter a measure anywhere below the horizontal gridline.

So just for easy reference, I’m going to enter below formula in the cell which is below the Profit column =SUM(Profit[Profit])/SUM(Sales[Sales])
DAX explanation: Here we are simply saying to divide Profit column with Sales column, however we have also asked it to sum both Profit & Sales before dividing because we want it to work at any level i.e. even if the user wants to see the data on the basis of cities, sum formula will help it to sum it at city level and then show result. Adding some kind of aggregation is mandatory in DAX if you are dealing with values. Skipping this step will result in errors in your DAX.
The moment we enter the formula and press enter, Power Pivot will automatically assign it a name like below

We may choose to change the name by just editing the same in the formula bar

And that's it, you have successfully created your 1st measure using DAX in Power Pivot. You will be able to see the result of the measure as well in the same cell

But this value is the sum of all the data, however its true purpose will be seen when you drag this measure into the pivot table. Now since we added this in Power Pivot, it will be available for us to use in the Pivot table as well. so let’s do the same

Now if you see, Profit% is available to us in the Pivot Table and when we drag that into the values section, it instantly gives us the results splitted on the basis of cities.
Creating Calculated Column in Power Pivot
Now the 2nd requirement was to create a new column inside the Power Pivot Profit table to get the first 2 characters from the Customer ID column. This is as simple as creating a new column in your excel sheet.
In your Data View, you will see a blank column at the end, which says Add Column

Click any cell in this column and enter below LEFT function in the formula bar, which is exactly the same formula which we use in excel sheets =LEFT(Profit[Customer ID],2)
The moment we hit enter, it will create a new column for you and assign it a default name

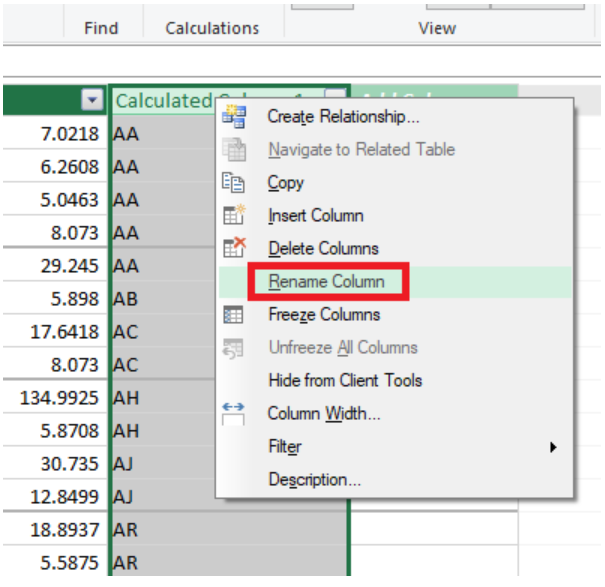
We can choose to change this to the name of our choice by right clicking on the column and pressing “Rename Column”


That’s it, we have now created a calculated column as well in Power Pivot. And similar to the measure this will also be available inside the Pivot Table for us to use.
However please remember, any new column or measure that we create needs to have a relationship with all the tables which are used to create that Pivot. So in this example if we drag the Short_CID column into the pivot then that will not give us the correct results because there is no common factor between Customer ID in the Profit table and the Sales table.
Commentaires