Know exactly where your money goes, from one simple Excel sheet.
My Money is a modern personal finance dashboard for Power BI. You keep a single Excel list of your transactions and the dashboard does the rest: cash flow, budgets, net worth, investments, debt, emergency fund and savings goals, all updated with one click.
No data modelling, no formulas, no custom visuals. Just type, save and refresh.
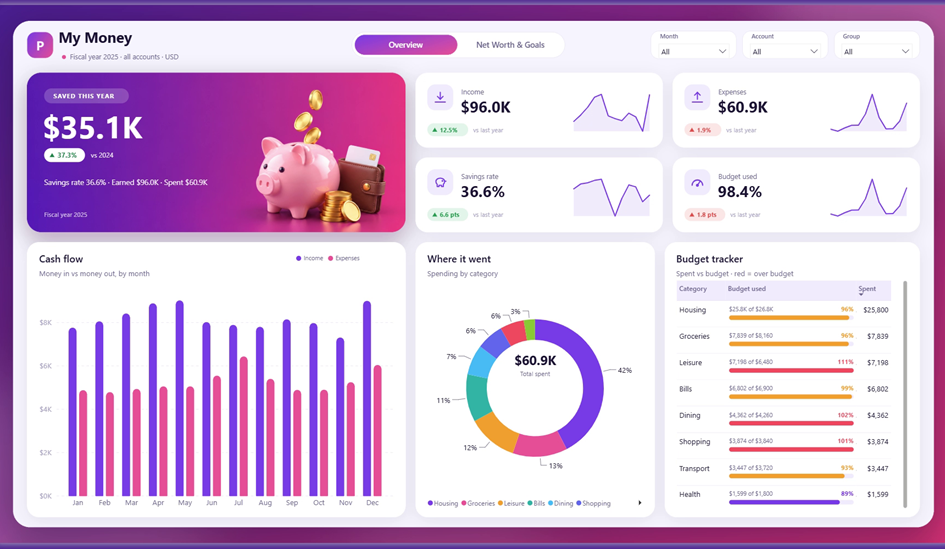
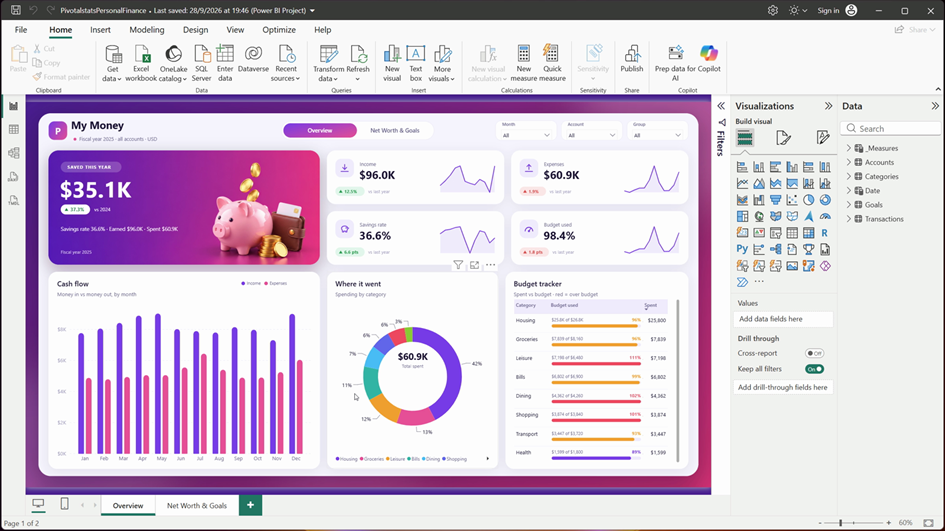
The finished My Money dashboard
Prefer the ready-made template? Get My Money for $9.99, with the dashboard, the Excel file and a step-by-step guide: {gumroad_product_url}
Watch the full build on YouTube: https://www.youtube.com/@PivotalstatsProjects (paste the video link here)
What you need
- Power BI Desktop from Microsoft (Windows), 2025 or newer
- Microsoft Excel
- The sample data file My Money.xlsx: {sample_data_url}
What you’ll build
In this guide you’ll build My Money, a two-page personal finance dashboard in Power BI, from a single Excel file. Page one shows what you saved this year, income and spending with prior-year comparisons, monthly cash flow, spending by category and a budget tracker. Page two shows net worth, account balances, an emergency-fund measure, savings goals and needs versus wants. Everything is built with Power Query, a small star-schema model, DAX measures and Microsoft’s standard visuals. No custom visuals are needed.
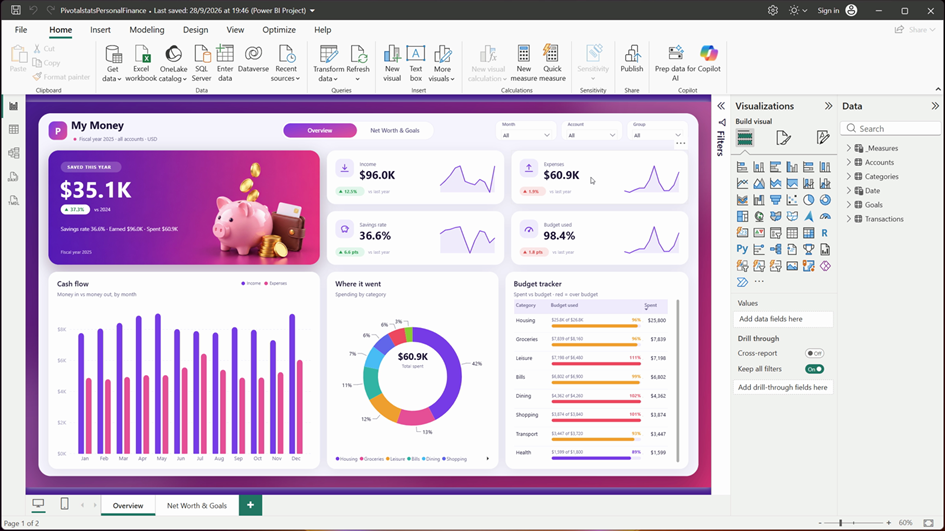
Saved this year
Step 01: A quick tour of the finished report
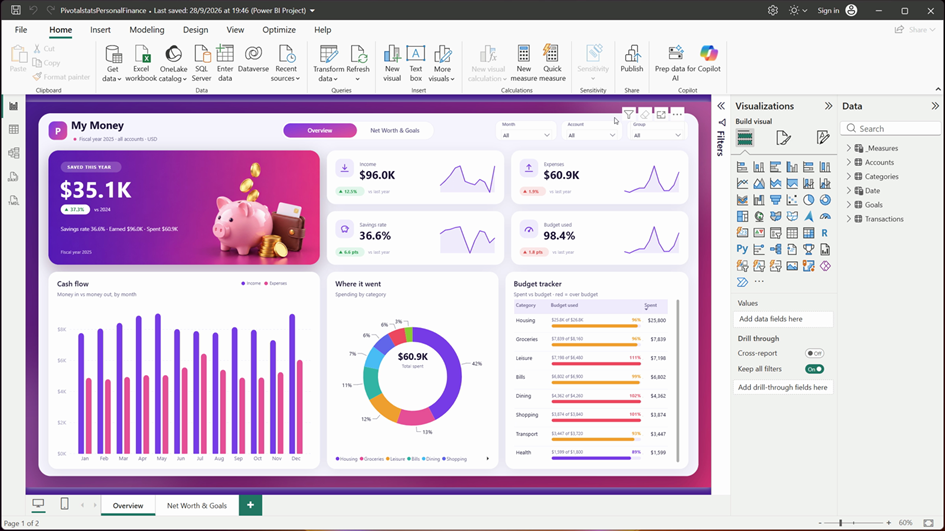
Before building, it helps to know where we’re going. The Overview page leads with a hero card for what you saved this year, then four KPI cards (income, expenses, savings rate and budget used), each with a badge comparing it with last year and a 12-month sparkline. Below them sit the cash-flow chart, a spending donut and the budget tracker.
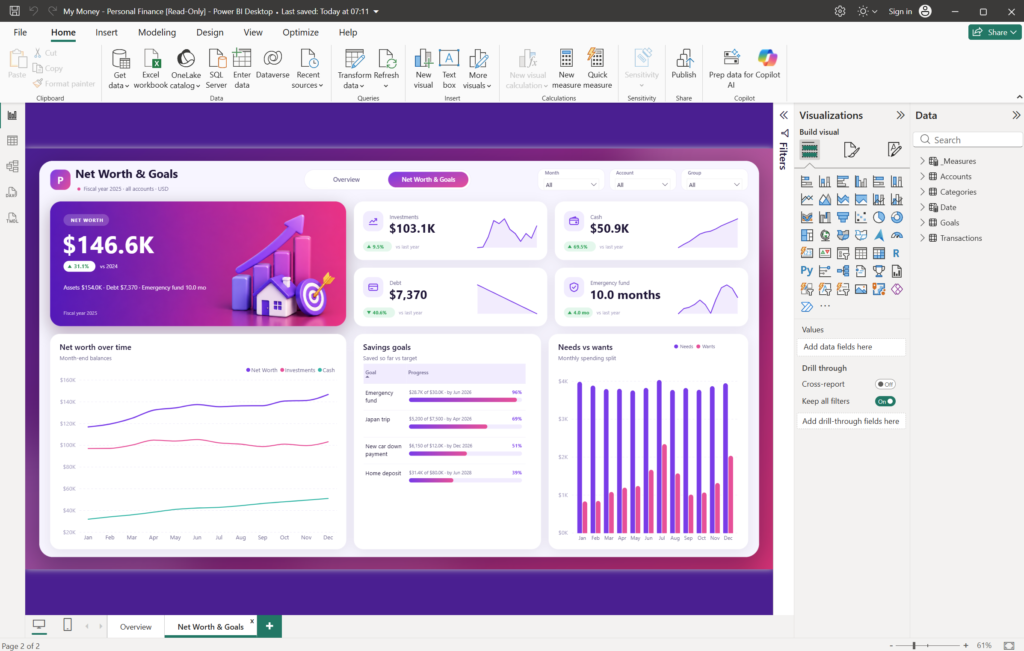
The Net Worth & Goals page follows the same layout: net worth, investments, cash, debt, emergency-fund months, net worth over time, savings-goal progress bars and needs versus wants. Slicers for month, account and group are synced across both pages.
Step 02: Set up the Excel file
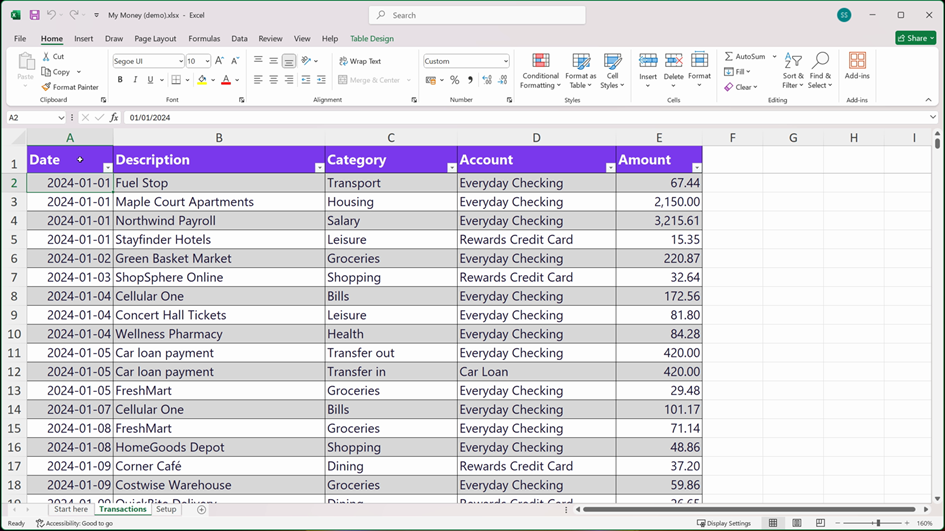
The workbook has two sheets you’ll use. Transactions is the only one you update regularly, and it has five columns: Date, Description, Category, Account and Amount. Make it a proper Excel table (Insert > Table) so new rows are picked up automatically, and give Category and Account data-validation dropdowns so a typo can’t split one category into two.
The Setup sheet is filled in once and holds three tables. Categories: each category belongs to a group (Income, Needs, Wants, Transfer out, Transfer in or Adjustment) and can have a monthly budget. Accounts: each has a type (Cash, Investments or Debt) and an opening balance on the day you start tracking, with debts entered as negative numbers. Goals: a name, a target, the amount saved so far and a target date.
Moving money between your own accounts, such as paying off a credit card, is two rows: Transfer out on one account and Transfer in on the other. That’s all the data entry. There are no formulas and no lookup tables.
Step 03: Connect to the workbook with a parameter
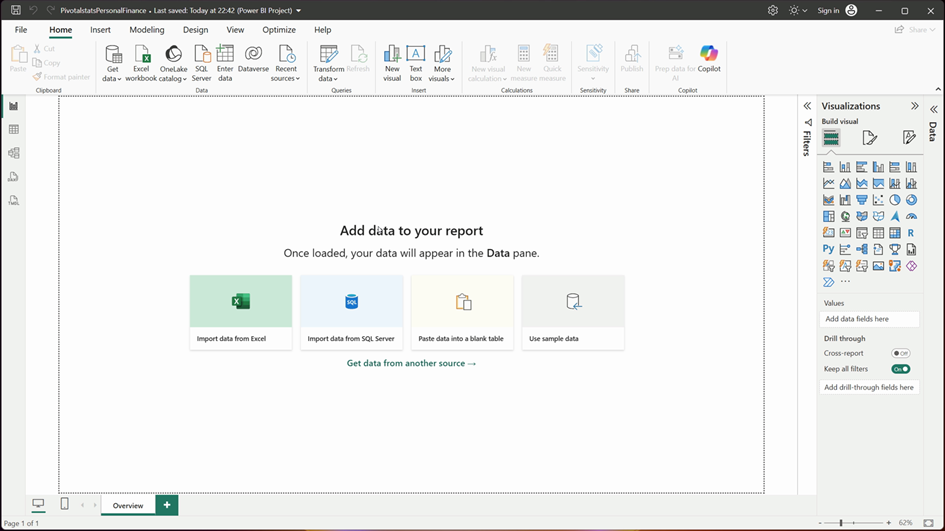
Open a blank report and go to Home > Transform data. A hard-coded file path is the most common reason a shared report stops refreshing, so start with a parameter: Manage Parameters > New Parameter, name it DataFile, set the type to Text and paste the full path to My Money.xlsx as the current value.
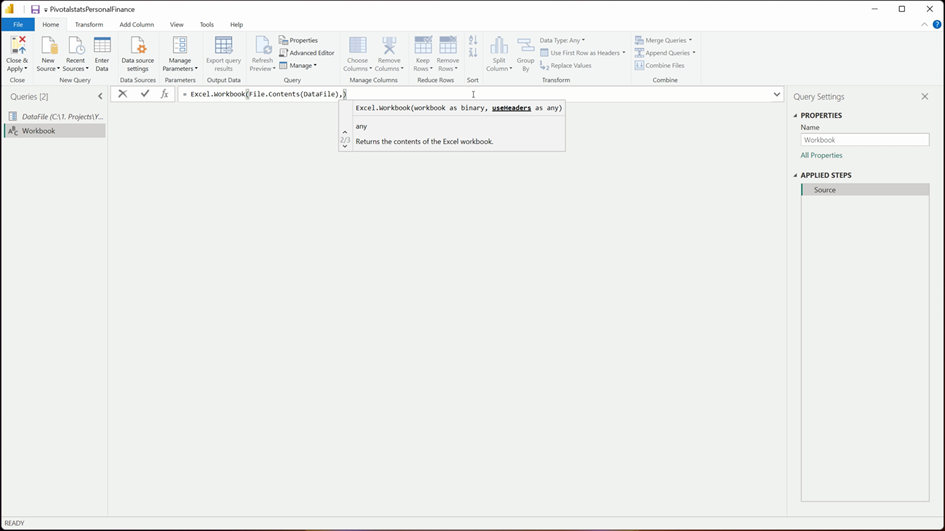
Then create New Source > Blank Query, rename it Workbook, and enter the formula below in the formula bar. Every other query starts from Workbook, so when the file moves there is exactly one place to change.
In the preview, notice the Kind column. Always pick the rows where Kind is Table, not Sheet: tables grow with your data and keep clean headers, while sheets pick up every stray cell.
let
    Source = Excel.Workbook(File.Contents(DataFile), null, true)
in
    Source
Step 04: Clean the transactions (TxRaw)
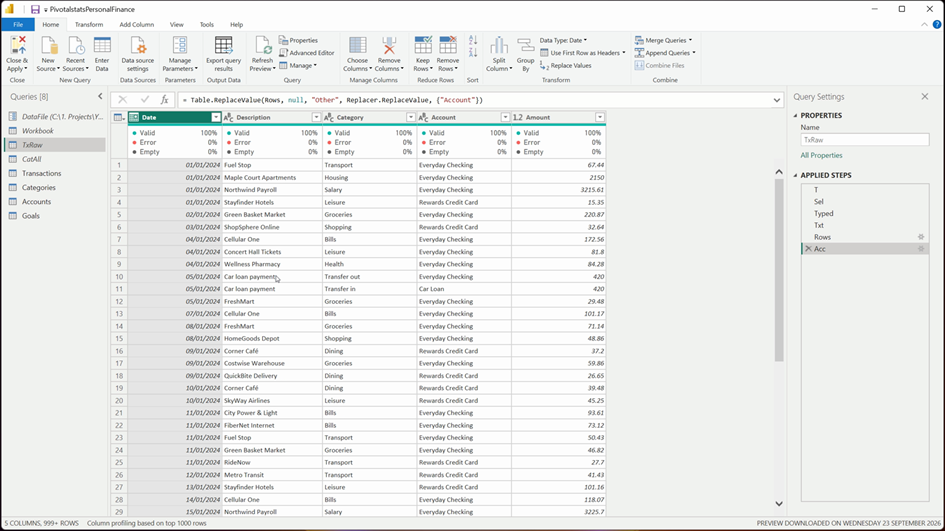
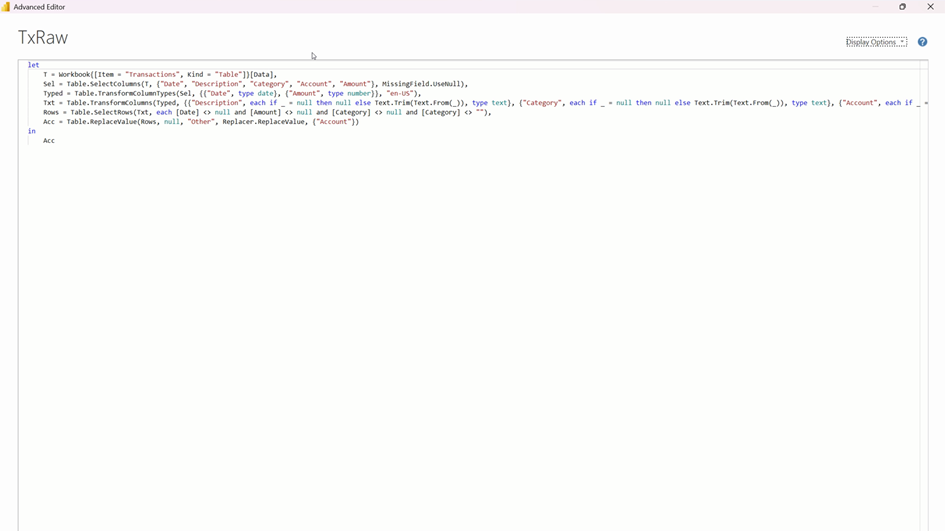
Create a staging query called TxRaw. It takes the Transactions table and keeps just the five columns. MissingField.UseNull means that if a column is ever missing, the query still runs instead of failing.
Set the types with an explicit en-US locale, so dates and decimals are read the same way on every computer, whatever its regional settings. Trim the text columns, because a trailing space in a category name would quietly create a second category. Remove any row without a date, an amount or a category, so a half-typed row can’t break the totals, and label an empty account as Other.
Nothing here is clever, and that’s the point: clean, predictable input keeps every measure later on simple.
let
    T = Workbook{[Item = "Transactions", Kind = "Table"]}[Data],
    Sel = Table.SelectColumns(T, {"Date", "Description", "Category", "Account", "Amount"}, MissingField.UseNull),
    Typed = Table.TransformColumnTypes(Sel, {{"Date", type date}, {"Amount", type number}}, "en-US"),
    Txt = Table.TransformColumns(Typed, {{"Description", each if _ = null then null else Text.Trim(Text.From(_)), type text}, {"Category", each if _ = null then null else Text.Trim(Text.From(_)), type text}, {"Account", each if _ = null then null else Text.Trim(Text.From(_)), type text}}),
    Rows = Table.SelectRows(Txt, each [Date] <> null and [Amount] <> null and [Category] <> null and [Category] <> ""),
    Acc = Table.ReplaceValue(Rows, null, "Other", Replacer.ReplaceValue, {"Account"})
in
    Acc
Step 05: Add Value, Type and Flow
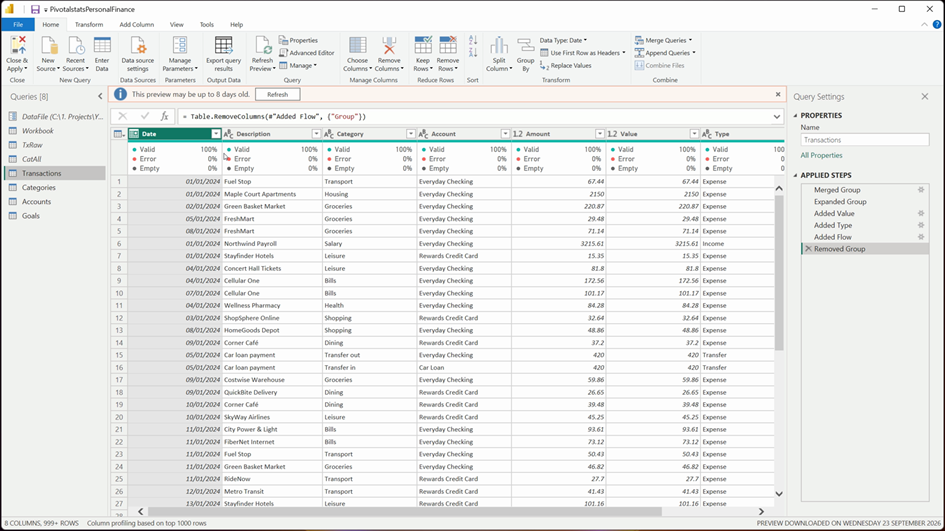
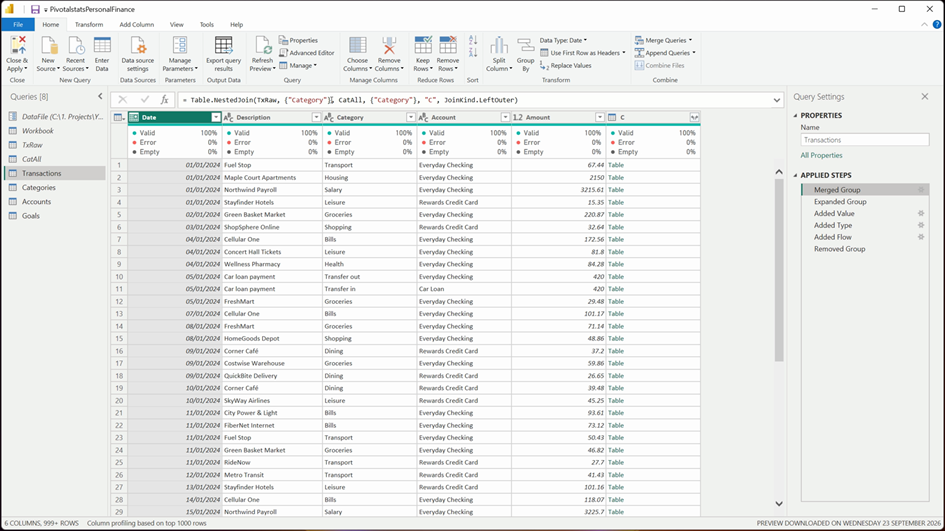
The Transactions query starts from TxRaw and merges in the group from the categories, so every row knows whether it’s income, a need, a want, a transfer or an adjustment.
Value is the absolute amount. Totals always use Value, so it doesn’t matter whether your bank export shows spending as negative numbers. Type maps the group to Income, Expense (needs and wants), Adjustment or Transfer. Transfers matter: moving money into savings is not spending, so it must never count as an expense. Flow is the signed amount used for balances: income and money arriving in an account are positive, spending and money leaving an account are negative, and adjustments keep their own sign. This one column lets you calculate every account balance and your net worth without typing a balance into Excel. Finally, remove the Group column; the relationship to Categories brings it back.
let
    #"Merged Group" = Table.NestedJoin(TxRaw, {"Category"}, CatAll, {"Category"}, "C", JoinKind.LeftOuter),
    #"Expanded Group" = Table.ExpandTableColumn(#"Merged Group", "C", {"Group"}),
    #"Added Value" = Table.AddColumn(#"Expanded Group", "Value", each Number.Abs([Amount]), type number),
    #"Added Type" = Table.AddColumn(#"Added Value", "Type", each if [Group] = "Income" then "Income"
            else if [Group] = "Needs" or [Group] = "Wants" then "Expense"
            else if [Group] = "Adjustment" then "Adjustment" else "Transfer", type text),
    #"Added Flow" = Table.AddColumn(#"Added Type", "Flow", each if [Group] = "Adjustment" then [Amount]
            else if [Group] = "Income" or [Group] = "Transfer in" then [Value] else - [Value], type number),
    #"Removed Group" = Table.RemoveColumns(#"Added Flow", {"Group"})
in
    #"Removed Group"
Step 06: Build forgiving lookup tables
The categories query (CatAll) reads the Setup table, renames Monthly Budget without the space and trims the text. It then compares against the transactions: any category typed in Transactions that isn’t in Setup yet is added automatically, in the Wants group, with no budget. So a new category invented on the fly is still included instead of silently dropping those rows. A sort-order column keeps your Setup order.
Accounts works the same way: an unknown account is added as a Cash account with an opening balance of zero. Goals is a simple clean-up of its table. When everything looks right, click Close & Apply.
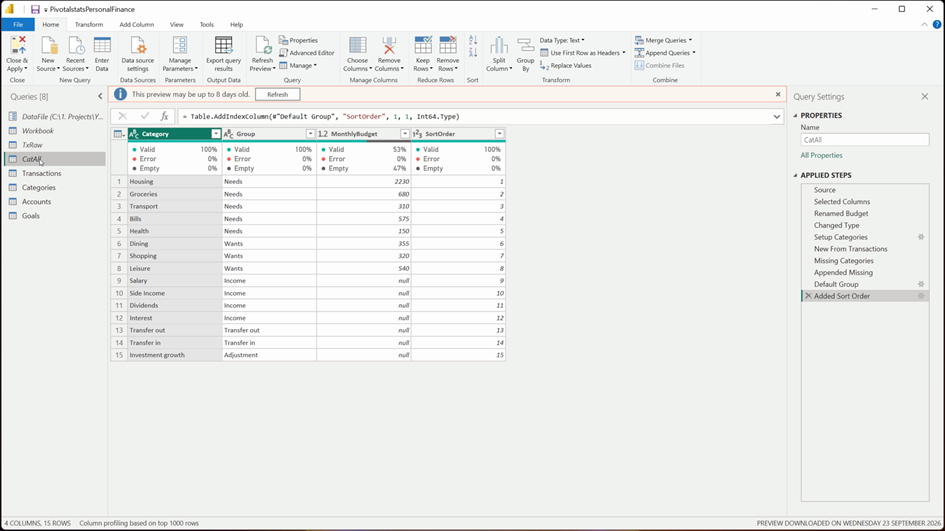
let
    Source = Workbook{[Item = "Categories", Kind = "Table"]}[Data],
    #"Selected Columns" = Table.SelectColumns(Source, {"Category", "Group", "Monthly Budget"}, MissingField.UseNull),
    #"Renamed Budget" = Table.RenameColumns(#"Selected Columns", {{"Monthly Budget", "MonthlyBudget"}}),
    #"Changed Type" = Table.TransformColumnTypes(Table.TransformColumns(#"Renamed Budget", {{"Category", each if _ = null then null else Text.Trim(Text.From(_)), type text}, {"Group", each if _ = null then null else Text.Trim(Text.From(_)), type text}}), {{"MonthlyBudget", type number}}),
    #"Setup Categories" = Table.SelectRows(#"Changed Type", each [Category] <> null and [Category] <> ""),
    #"New From Transactions" = List.Difference(List.Distinct(TxRaw[Category]), #"Setup Categories"[Category]),
    #"Missing Categories" = Table.FromRecords(List.Transform(#"New From Transactions", each [Category = _, Group = "Wants", MonthlyBudget = null])),
    #"Appended Missing" = if List.IsEmpty(#"New From Transactions") then #"Setup Categories" else Table.Combine({#"Setup Categories", #"Missing Categories"}),
    #"Default Group" = Table.ReplaceValue(#"Appended Missing", null, "Wants", Replacer.ReplaceValue, {"Group"}),
    #"Added Sort Order" = Table.AddIndexColumn(#"Default Group", "SortOrder", 1, 1, Int64.Type)
in
    #"Added Sort Order"
let
    S = Workbook{[Item = "Accounts", Kind = "Table"]}[Data],
    Sel = Table.SelectColumns(S, {"Account", "Type", "Opening Balance"}, MissingField.UseNull),
    Ren = Table.RenameColumns(Sel, {{"Opening Balance", "OpeningBalance"}}),
    Typed = Table.TransformColumnTypes(Table.TransformColumns(Ren, {{"Account", each if _ = null then null else Text.Trim(Text.From(_)), type text}, {"Type", each if _ = null then null else Text.Trim(Text.From(_)), type text}}), {{"OpeningBalance", type number}}),
    Known = Table.SelectRows(Typed, each [Account] <> null and [Account] <> ""),
    Missing = List.Difference(List.Distinct(TxRaw[Account]), Known[Account]),
    Extra = Table.FromRecords(List.Transform(Missing, each [Account = _, Type = "Cash", OpeningBalance = 0])),
    All = if List.IsEmpty(Missing) then Known else Table.Combine({Known, Extra}),
    Fix = Table.ReplaceValue(Table.ReplaceValue(All, null, 0, Replacer.ReplaceValue, {"OpeningBalance"}), null, "Cash", Replacer.ReplaceValue, {"Type"})
in
    Fix
Step 07: Model and date table
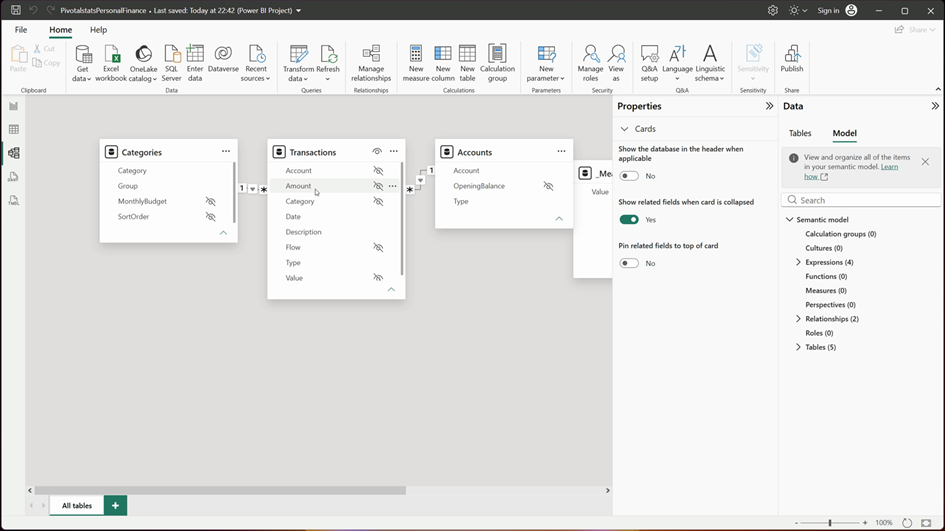
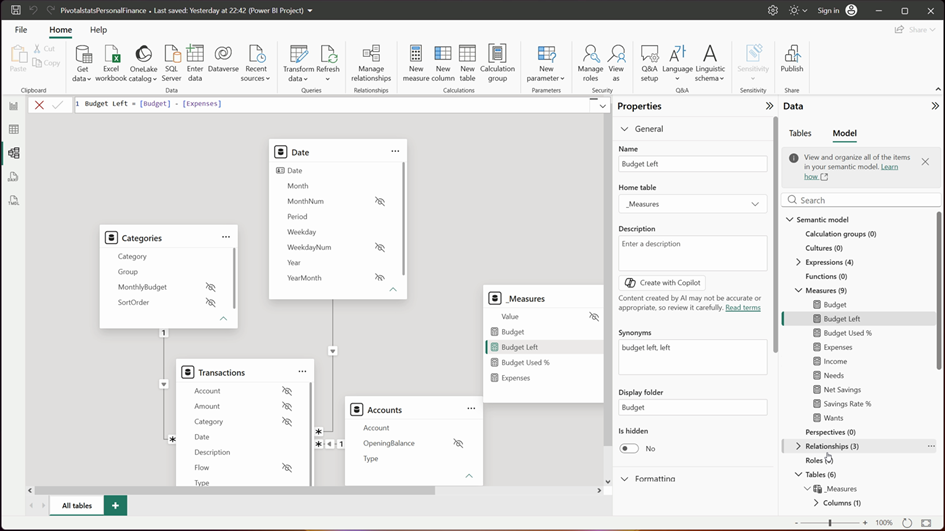
In Model view, Transactions sits in the middle with Categories and Accounts on either side, joined on Category and Account: a small, clean star schema.
Add the date table in DAX with Home > New table. CALENDAR builds every day from 1 January of the first year in your transactions to 31 December of the last, and ADDCOLUMNS adds year, month number, short month name, a year-month number and weekday columns. The most useful column is Period: it labels the newest year as Latest year, so a report filter on Period always opens on your current year and moves on by itself when January’s transactions arrive.
Then sort Month by MonthNum (Column tools > Sort by column), mark the table as a date table using its Date column, and create the relationship Transactions[Date] to Date[Date] (many to one, single direction).
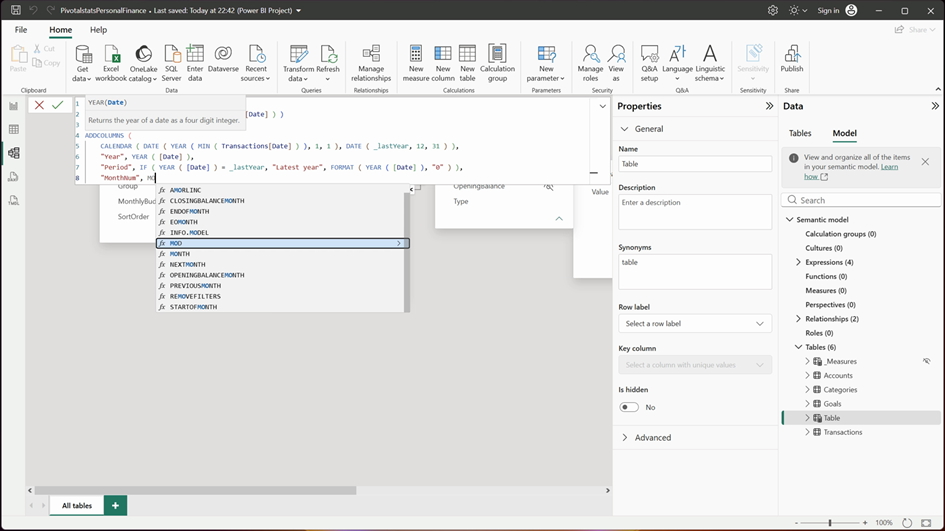
Date =
VAR _lastYear = YEAR ( MAX ( Transactions[Date] ) )
RETURN
    ADDCOLUMNS (
        CALENDAR ( DATE ( YEAR ( MIN ( Transactions[Date] ) ), 1, 1 ), DATE ( _lastYear, 12, 31 ) ),
        "Year", YEAR ( [Date] ),
        "Period", IF ( YEAR ( [Date] ) = _lastYear, "Latest year", FORMAT ( YEAR ( [Date] ), "0" ) ),
        "MonthNum", MONTH ( [Date] ),
        "Month", FORMAT ( [Date], "mmm", "en-US" ),
        "YearMonth", YEAR ( [Date] ) * 100 + MONTH ( [Date] ),
        "WeekdayNum", WEEKDAY ( [Date], 2 ),
        "Weekday", FORMAT ( [Date], "ddd", "en-US" )
    )
Step 08: Core measures and budgets
Keep every measure in one table called _Measures, organised into display folders. Income is the sum of Value where Type is Income, and Expenses is the same for Expense. KEEPFILTERS makes the measure respect any filter already on the page instead of overriding it. Net Savings is Income minus Expenses, and Savings Rate % uses DIVIDE, which returns blank rather than an error when there’s no income yet. Needs and Wants filter Expenses by category group.
Budgets need one more idea. The Setup sheet stores a monthly budget, but you might be looking at a whole year. The Budget measure counts how many months you actually have data for and multiplies the monthly budgets by that number. Budget Used % is Expenses divided by Budget, and Budget Left is what remains.
Income = CALCULATE ( SUM ( Transactions[Value] ), KEEPFILTERS ( Transactions[Type] = "Income" ) )Expenses = CALCULATE ( SUM ( Transactions[Value] ), KEEPFILTERS ( Transactions[Type] = "Expense" ) )Net Savings = [Income] - [Expenses]Savings Rate % = DIVIDE ( [Net Savings], [Income] )Needs = CALCULATE ( [Expenses], KEEPFILTERS ( Categories[Group] = "Needs" ) )Wants = CALCULATE ( [Expenses], KEEPFILTERS ( Categories[Group] = "Wants" ) )Budget =
VAR _last = CALCULATE ( MAX ( Transactions[Date] ), REMOVEFILTERS () )
VAR _first = CALCULATE ( MIN ( Transactions[Date] ), REMOVEFILTERS () )
VAR _months =
COUNTROWS (
FILTER (
VALUES ( 'Date'[YearMonth] ),
'Date'[YearMonth] <= YEAR ( _last ) * 100 + MONTH ( _last )
&& 'Date'[YearMonth] >= YEAR ( _first ) * 100 + MONTH ( _first )
)
)
RETURN IF ( _months > 0, SUM ( Categories[MonthlyBudget] ) * _months )
Budget Used % = DIVIDE ( [Expenses], [Budget] )Budget Left = [Budget] - [Expenses]Step 09: Balances and net worth
For any date, an account’s balance is its opening balance plus every flow up to that date. Balance sums the opening balances and adds the sum of Flow with the date filter removed and replaced by one that keeps every day up to the last visible date. It also stops at your last transaction, so future months stay blank instead of repeating the same number.
Because it still respects the account filter, one measure does everything: Cash, Investments and Debt are Balance filtered by account type (with Debt flipped to a positive number), Net Worth is Balance across all accounts, and Assets is cash plus investments. Emergency Fund Months divides cash by average monthly expenses. Three small measures sum the goal targets and savings and divide them for progress. Finally, every headline measure gets a prior-year twin using SAMEPERIODLASTYEAR; those power all the badges that compare this year with last year. Income PY is shown below, and the others follow the same pattern.
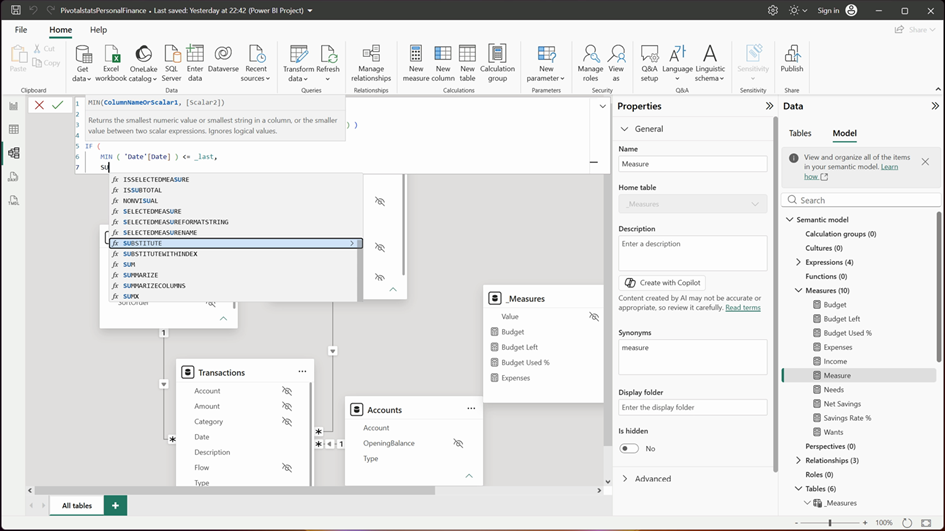
Balance =
VAR _d = MAX ( 'Date'[Date] )
VAR _last = CALCULATE ( MAX ( Transactions[Date] ), REMOVEFILTERS () )
RETURN
    IF (
        MIN ( 'Date'[Date] ) <= _last,
        SUM ( Accounts[OpeningBalance] )
            + CALCULATE ( SUM ( Transactions[Flow] ), REMOVEFILTERS ( 'Date' ), REMOVEFILTERS ( Categories ), 'Date'[Date] <= _d ) + 0
    )
Net Worth = [Balance]Cash = CALCULATE ( [Balance], KEEPFILTERS ( Accounts[Type] = "Cash" ) )Investments = CALCULATE ( [Balance], KEEPFILTERS ( Accounts[Type] = "Investments" ) )Debt = - CALCULATE ( [Balance], KEEPFILTERS ( Accounts[Type] = "Debt" ) )Assets = [Cash] + [Investments]Avg Monthly Expenses = DIVIDE ( [Expenses], CALCULATE ( DISTINCTCOUNT ( 'Date'[YearMonth] ), Transactions ) )Emergency Fund Months = DIVIDE ( [Cash], [Avg Monthly Expenses] )Goal Progress % = DIVIDE ( [Goal Saved], [Goal Target] )Income PY = CALCULATE ( [Income], SAMEPERIODLASTYEAR ( 'Date'[Date] ) )Step 10: App-style design
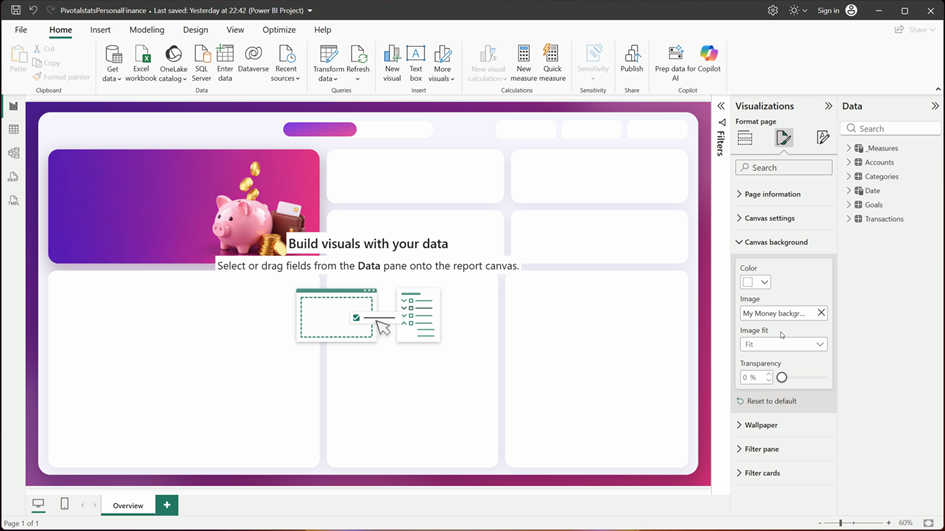
The app look comes from one simple idea: the rounded window, the cards and the soft shadows are all a single background image. Select the page, open Format page > Canvas background, browse to the image, set transparency to 0% and image fit to Fit. The image must be exactly 1920 x 1080, or Power BI will zoom it.
On the Design tab, choose Import theme and load the JSON theme. It sets the purple and pink palette, the fonts and the defaults for every chart, so each new visual already matches.
Only neutral shapes live in the background. The logo is a separate image visual and every title is a text box, so the report can be rebranded in seconds. Add slicers for Month, Account and Group and sync them across both pages (View > Sync slicers). In the Filters pane, set Period to Latest year on all pages.
Step 11: Charts and rounded bars
For cash flow, add a clustered column chart with Month on the X-axis and Income and Expenses as values. Power BI has no setting for rounded columns, but error bars get you there natively: in the Analytics pane turn on error bars for each series from zero up to the value, make each bar as wide as the column and give it a circular marker. The circle becomes the rounded top. Then colour the real columns the same as the card, so only the rounded bars remain. Tooltips and cross-filtering still work, because they come from the hidden columns. A small measure sets the axis maximum 10% above the tallest month for headroom.
The spending donut shows Expenses by Category, with the total in the middle drawn by a small image measure placed on top. The budget tracker is a table with the category, an image column showing spent against budget (amber above 90%, red when over) and the amount. On the second page, a line chart shows net worth, investments and cash by month, the goals table draws a progress bar per goal, and needs versus wants reuses the rounded-bar trick.
Axis Max Cash Flow = MAXX ( VALUES ( 'Date'[MonthNum] ), MAX ( [Income], [Expenses] ) ) * 1.1Step 12: SVG KPI cards
The KPI cards aren’t card visuals. Each one is a DAX measure that writes a small SVG picture as text: the icon, the value formatted in thousands or millions, a green or red badge from the prior-year measure, and a sparkline built from the twelve monthly values, all from live numbers.
Set the measure’s data category to Image URL (Measure tools), add a standard Image visual and point its image URL at the measure. It redraws every time a filter changes. You get full design freedom with zero custom visuals, which matters when your company only allows certified visuals. The hero card works the same way, sitting on top of a 3D illustration in the background.
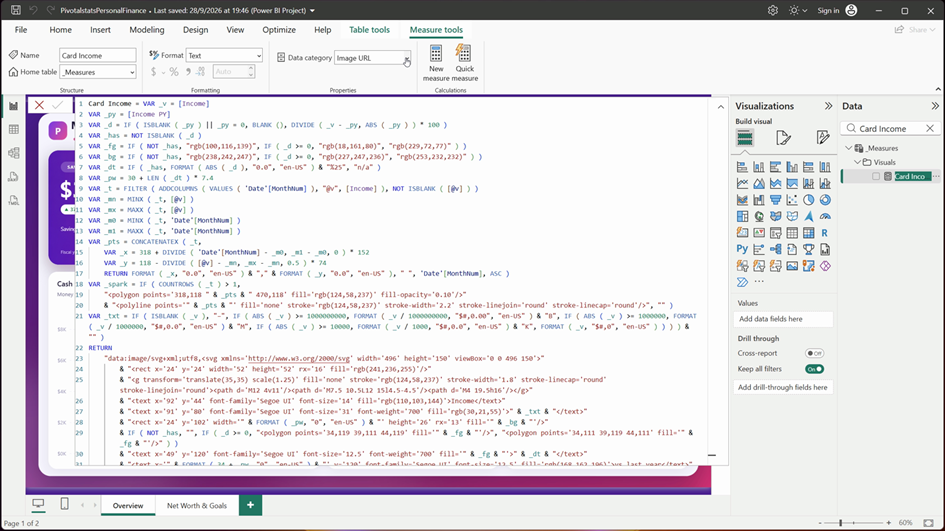
Card Income =
VAR _v = [Income]
VAR _py = [Income PY]
VAR _d = IF ( ISBLANK ( _py ) || _py = 0, BLANK (), DIVIDE ( _v - _py, ABS ( _py ) ) * 100 )
VAR _has = NOT ISBLANK ( _d )
VAR _fg = IF ( NOT _has, "rgb(100,116,139)", IF ( _d >= 0, "rgb(18,161,80)", "rgb(229,72,77)" ) )
VAR _bg = IF ( NOT _has, "rgb(238,242,247)", IF ( _d >= 0, "rgb(227,247,236)", "rgb(253,232,232)" ) )
VAR _dt = IF ( _has, FORMAT ( ABS ( _d ), "0.0", "en-US" ) & "%25", "n/a" )
VAR _pw = 30 + LEN ( _dt ) * 7.4
VAR _t = FILTER ( ADDCOLUMNS ( VALUES ( 'Date'[MonthNum] ), "@v", [Income] ), NOT ISBLANK ( [@v] ) )
VAR _mn = MINX ( _t, [@v] )
VAR _mx = MAXX ( _t, [@v] )
VAR _m0 = MINX ( _t, 'Date'[MonthNum] )
VAR _m1 = MAXX ( _t, 'Date'[MonthNum] )
VAR _pts = CONCATENATEX ( _t,
    VAR _x = 318 + DIVIDE ( 'Date'[MonthNum] - _m0, _m1 - _m0, 0 ) * 152
    VAR _y = 118 - DIVIDE ( [@v] - _mn, _mx - _mn, 0.5 ) * 74
    RETURN FORMAT ( _x, "0.0", "en-US" ) & "," & FORMAT ( _y, "0.0", "en-US" ), " ", 'Date'[MonthNum], ASC )
VAR _spark = IF ( COUNTROWS ( _t ) > 1,
    "<polygon points='318,118 " & _pts & " 470,118' fill='rgb(124,58,237)' fill-opacity='0.10'/>"
    & "<polyline points='" & _pts & "' fill='none' stroke='rgb(124,58,237)' stroke-width='2.2' stroke-linejoin='round' stroke-linecap='round'/>", "" )
VAR _txt = IF ( ISBLANK ( _v ), "–", IF ( ABS ( _v ) >= 1000000000, FORMAT ( _v / 1000000000, "$#,0.00", "en-US" ) & "B", IF ( ABS ( _v ) >= 1000000, FORMAT ( _v / 1000000, "$#,0.0", "en-US" ) & "M", IF ( ABS ( _v ) >= 10000, FORMAT ( _v / 1000, "$#,0.0", "en-US" ) & "K", FORMAT ( _v, "$#,0", "en-US" ) ) ) ) & "" )
RETURN
    "data:image/svg+xml;utf8,<svg xmlns='http://www.w3.org/2000/svg' width='496' height='150' viewBox='0 0 496 150'>"
        & "<rect x='24' y='24' width='52' height='52' rx='16' fill='rgb(241,236,255)'/>"
        & "<g transform='translate(35,35) scale(1.25)' fill='none' stroke='rgb(124,58,237)' stroke-width='1.8' stroke-linecap='round' stroke-linejoin='round'><path d='M12 4v11'/><path d='M7.5 10.5L12 15l4.5-4.5'/><path d='M4 19.5h16'/></g>"
        & "<text x='92' y='44' font-family='Segoe UI' font-size='14' fill='rgb(110,103,144)'>Income</text>"
        & "<text x='91' y='80' font-family='Segoe UI' font-size='31' font-weight='700' fill='rgb(30,21,55)'>" & _txt & "</text>"
        & "<rect x='24' y='102' width='" & FORMAT ( _pw, "0", "en-US" ) & "' height='26' rx='13' fill='" & _bg & "'/>"
        & IF ( NOT _has, "", IF ( _d >= 0, "<polygon points='34,119 39,111 44,119' fill='" & _fg & "'/>", "<polygon points='34,111 39,119 44,111' fill='" & _fg & "'/>" ) )
        & "<text x='49' y='120' font-family='Segoe UI' font-size='12.5' font-weight='700' fill='" & _fg & "'>" & _dt & "</text>"
        & "<text x='" & FORMAT ( 34 + _pw, "0", "en-US" ) & "' y='120' font-family='Segoe UI' font-size='12.5' fill='rgb(168,162,196)'>vs last year</text>"
        & _spark
        & "</svg>"
Step 13: Refresh and you’re done
To test the whole flow, add a new expense in the Excel Transactions table, save the file, and click Home > Refresh in Power BI. Spending, the budget tracker, account balances and net worth all update. From now on that’s the whole routine: type, save, refresh.
Wrap-up
You’ve now built a complete personal finance dashboard: Power Query with a single file-path parameter, a star schema with a DAX date table, around fifty measures, and an app-style design using only standard visuals.
If you’d rather start from the finished file, the ready-made template includes the dashboard, the Excel workbook and a step-by-step setup guide.
Prefer the ready-made template? Get My Money for $9.99, with the dashboard, the Excel file and a step-by-step guide:
https://pivotalstats.gumroad.com/l/my-money-power-bi
More dashboards: https://www.youtube.com/@PivotalstatsProjects · https://pivotalstats.com