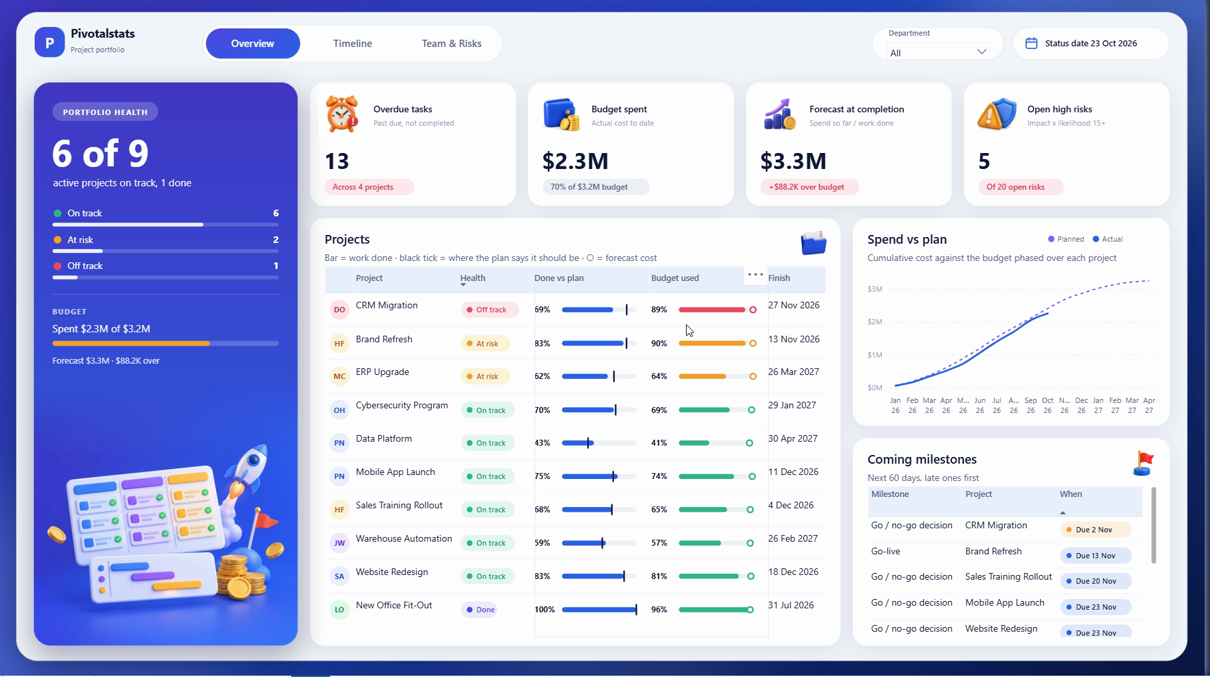
Project Management Dashboard in Power BI (Gantt Chart, RAG Status and Budget from One Excel File)
Paste your Planner export, click Refresh, and see which project is slipping and who is overloaded. Project Management is a
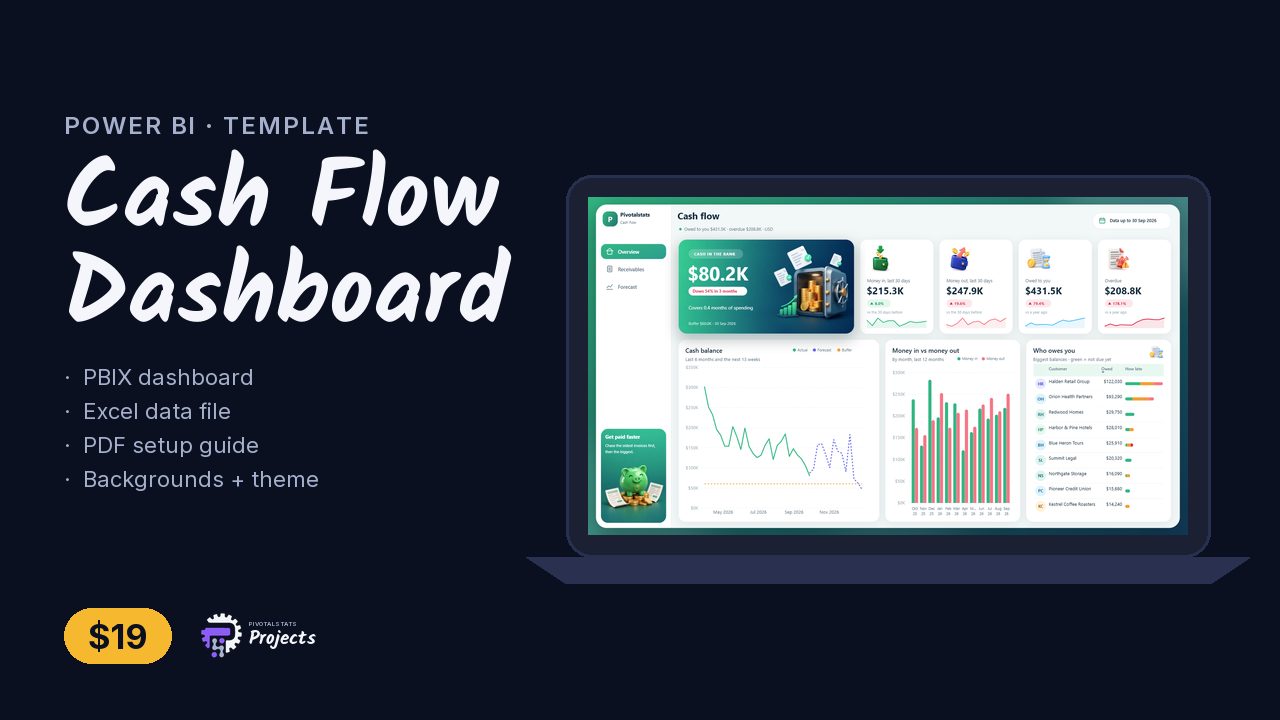
Build a Cash Flow Dashboard in Power BI (13-Week Forecast and Who Owes You, from One Excel File)
Paste your bank export and invoice list, click Refresh, and see the week you run short. Cash Flow is a
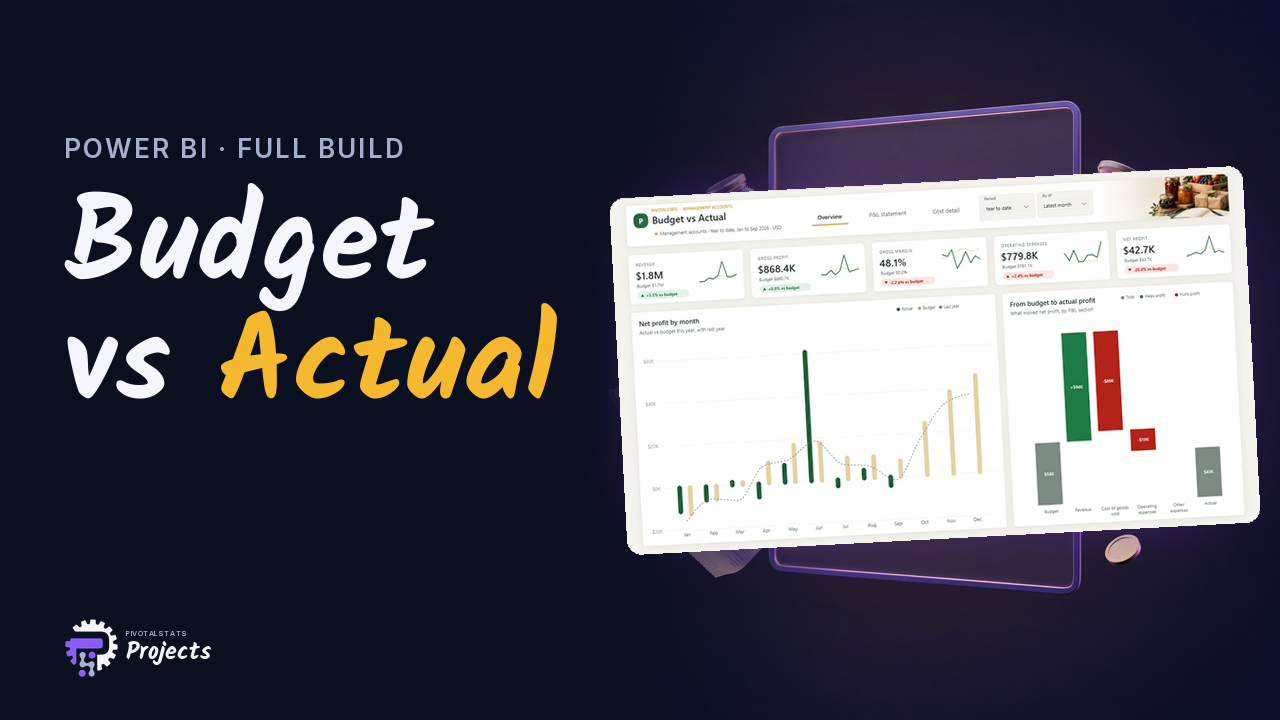
Build a Budget vs Actual Dashboard in Power BI (Small Business P&L from One Excel File)
Drop in your accounting export and click Refresh. Your P&L against budget, ready to send. Budget vs Actual is a

Build a Personal Finance Dashboard in Power BI (From One Excel Sheet)
Know exactly where your money goes, from one simple Excel sheet. My Money is a modern personal finance dashboard for
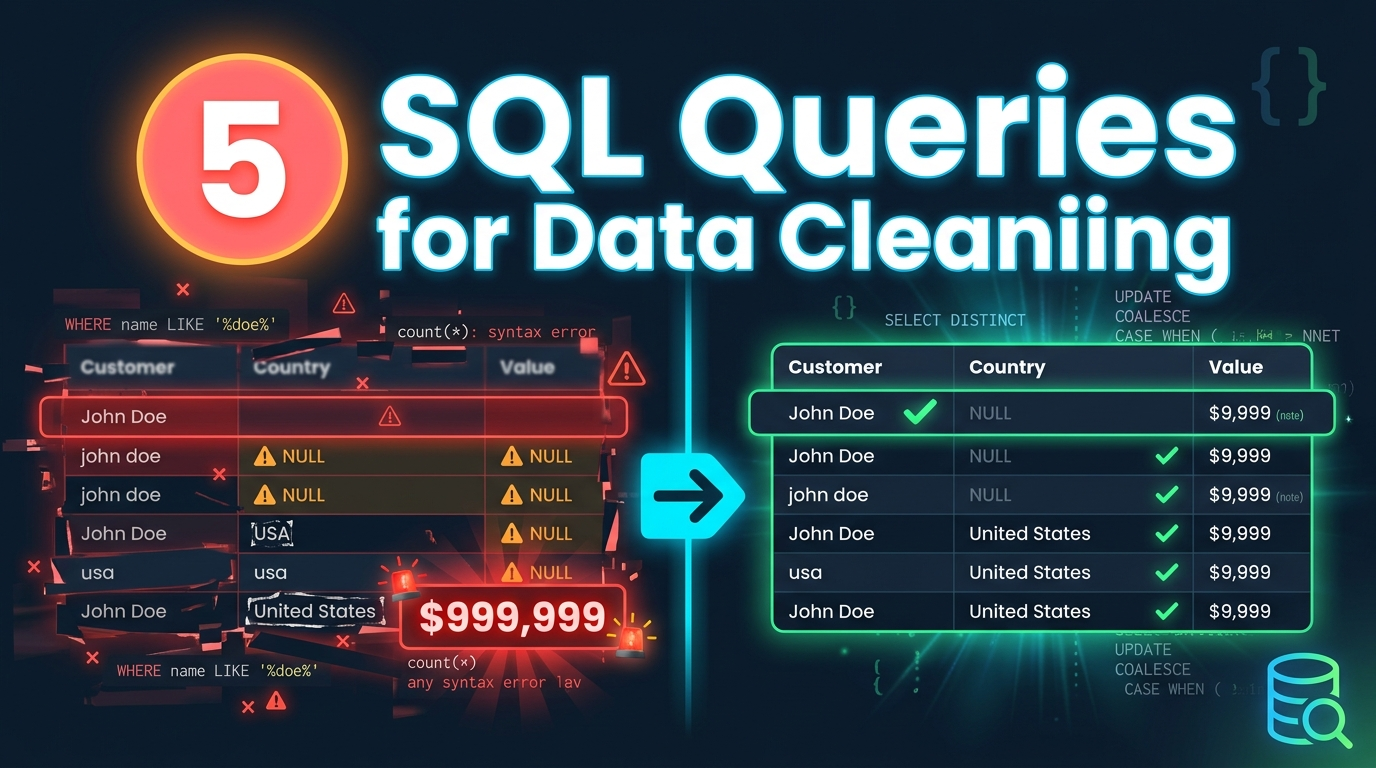
Five Essential SQL Queries Every Data Analyst Needs for Effective Data Cleaning Operations
If you’ve ever inherited a dataset which includes duplicate records, missing values, inconsistent formatting, you know that data cleaning isn’t
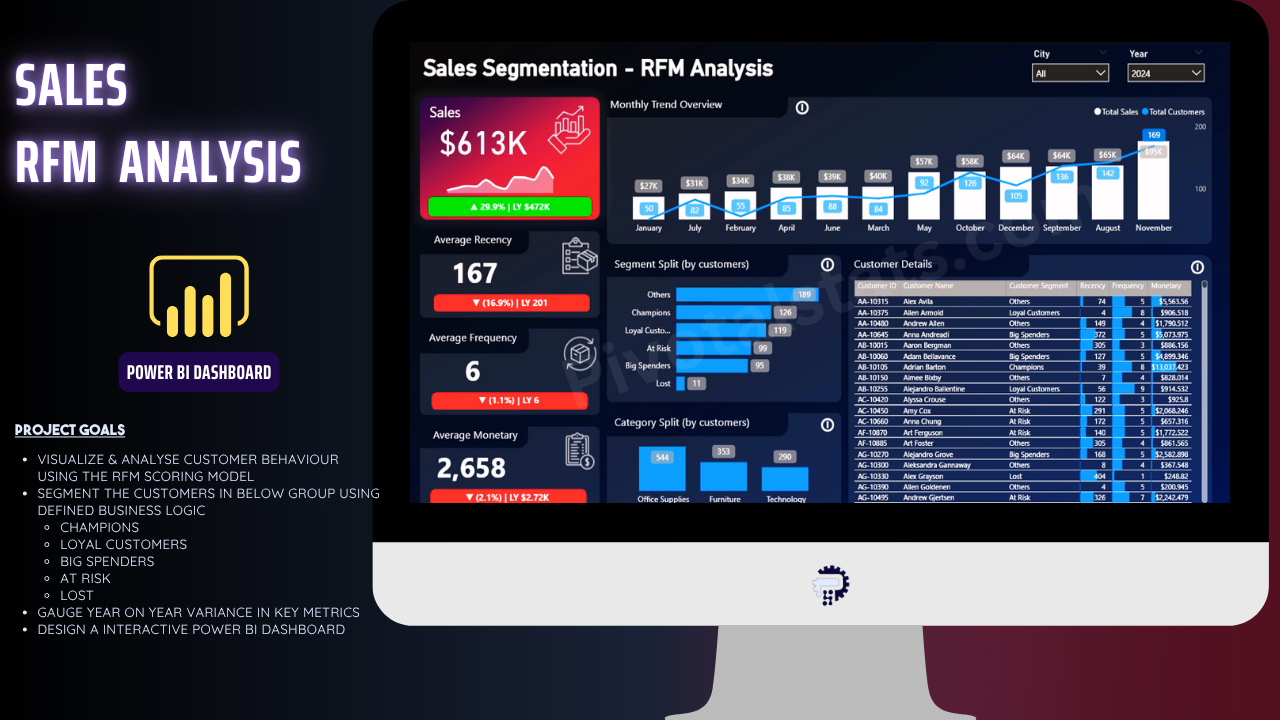
Sales RFM Analysis Portfolio Project
Introduction Have you ever wondered which of your customers are your most valuable, and which ones you might be losing?

How to Manage and Optimize Power BI Reports for Very Large Datasets
Handling very large datasets in Power BI can be a daunting task, especially when you’re dealing with millions of rows
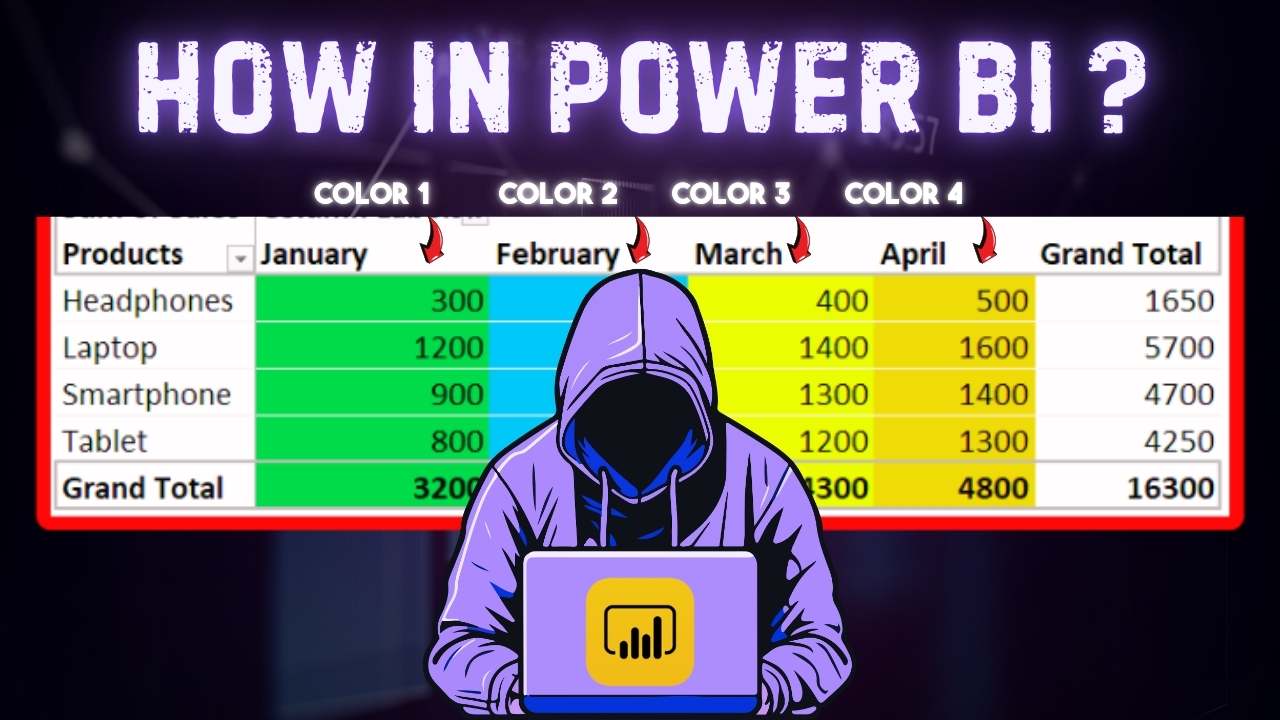
Dynamic Color Coding for Individual Column in Power BI
While working on a project which revolved around migrating a suite of excel reports and creating an exact replica of

Top 5 Usages of EARLIER dax function in Power BI
While working on a project I came across a scenario where I had to create a calculated column and reference

How to reduce Measure clutter using CALCULATION GROUP in Power BI
When analyzing business performance, it’s crucial to compare key metrics like sales, returns, and quantities over various time periods. Creating