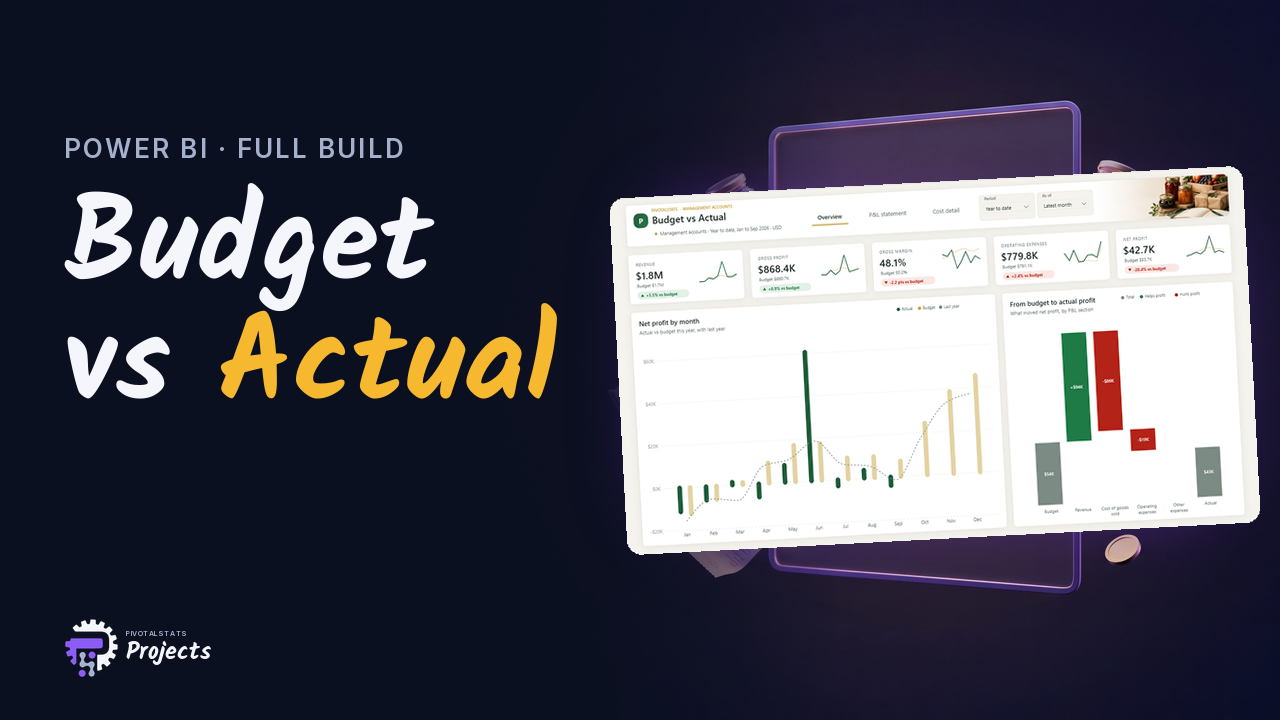
Drop in your accounting export and click Refresh. Your P&L against budget, ready to send.
Budget vs Actual is a management-accounts dashboard for Power BI. Paste a flat export from your accounting software into one Excel workbook, click Refresh, and you get a proper P&L against budget: every line, every subtotal, the variance in dollars and percent, and last year alongside. The fiddly part of a P&L in Power BI is the layout: the row order, the headers and the subtotal lines that don’t exist in your data. That is already solved here with a simple layout table you edit in Excel, so you can match your own chart of accounts in minutes
Prefer the ready-made template? Get Budget vs Actual for $19, with the dashboard, the Excel file and a step-by-step guide: https://pivotalstats.gumroad.com/l/budget-vs-actual-power-bi
Watch the full build on YouTube: https://www.youtube.com/@PivotalstatsProjects
https://youtu.be/ZR7QeSCZh6g
What you need
- Power BI Desktop from Microsoft (Windows), 2025 or newer
- Microsoft Excel
- The sample data file Budget vs Actual.xlsx: {sample_data_url}
What you’ll build
A budget versus actual dashboard for a small business, built in Power BI from one Excel workbook: a real P&L with subtotals, variances coloured by whether they help or hurt profit, a budget-to-actual profit bridge and a cost page that points at the overspend.
It uses Power Query, a small star schema, DAX user-defined functions and only Microsoft’s standard visuals.
Step 01: A tour of the dashboard
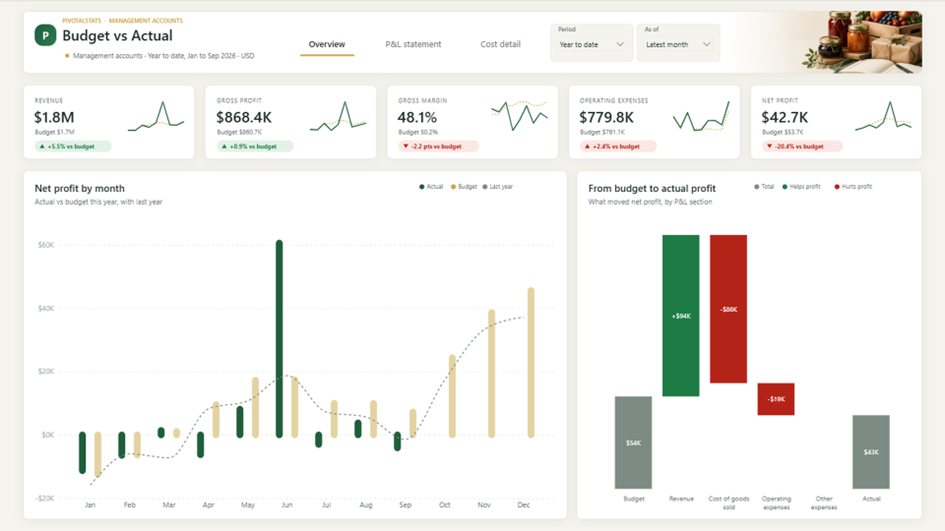
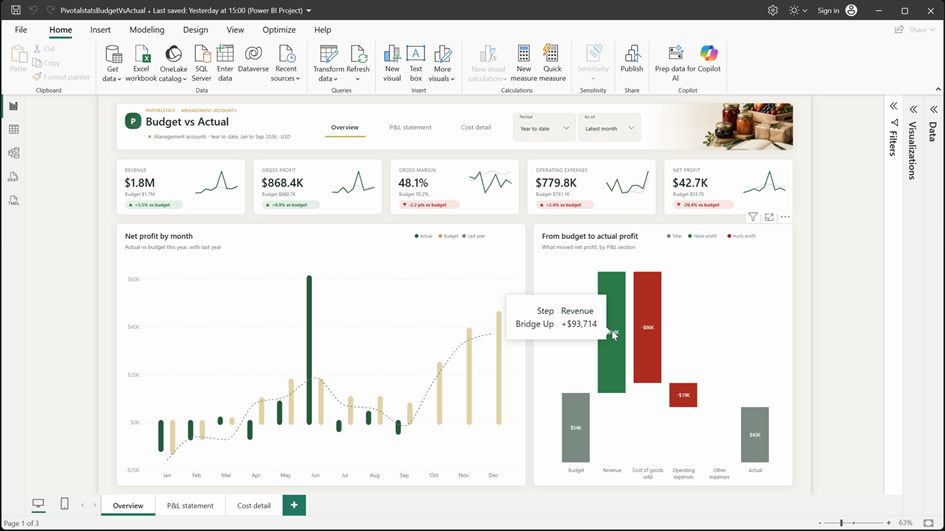
The Overview page has five variance tiles (revenue, gross profit, gross margin, operating expenses and net profit), net profit by month against budget and last year, and a budget-to-actual bridge.
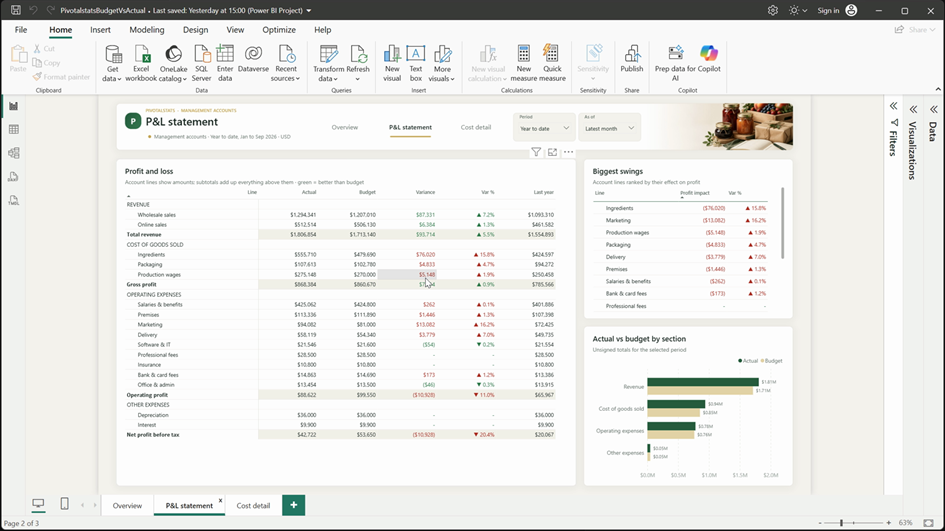
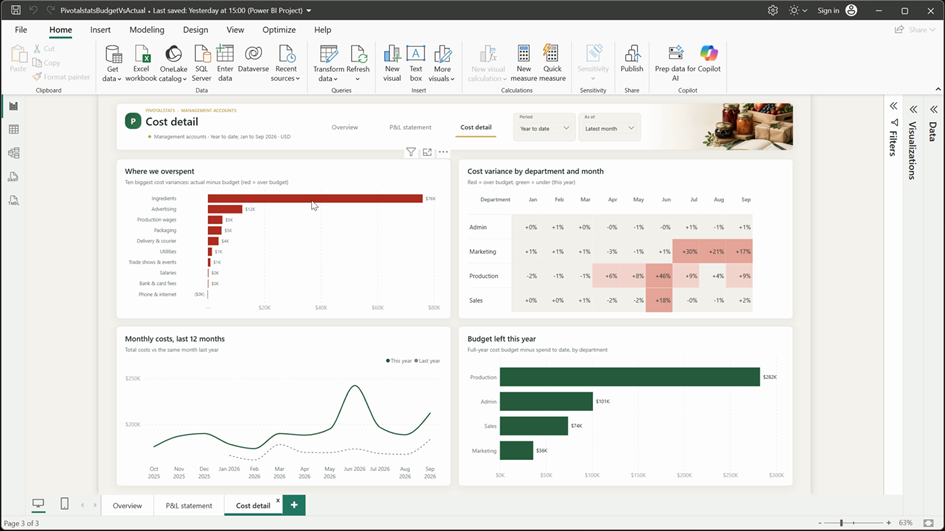
The P&L statement page is a native matrix laid out like management accounts. The Cost detail page ranks cost overruns and shows them by department and month.
Two slicers in the header control everything: Period (year to date or month) and As of (the month you report on).
Step 02: One Excel workbook
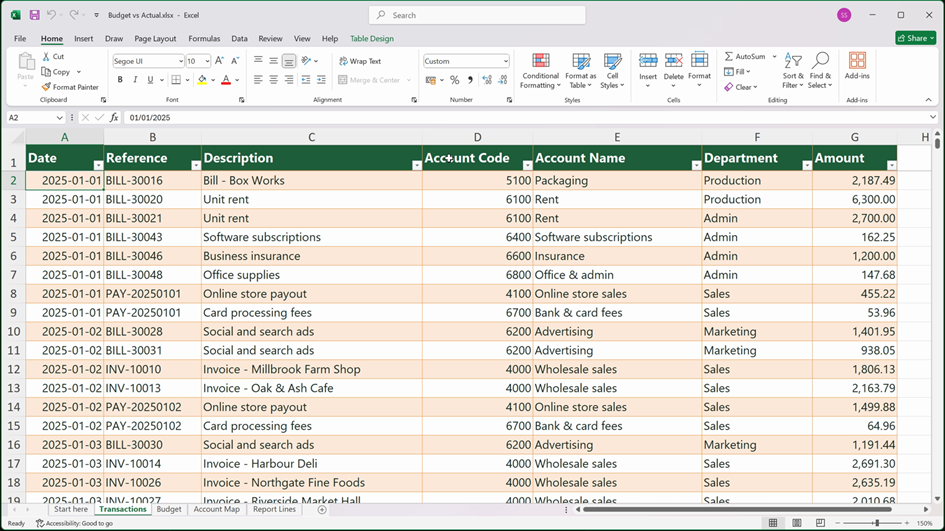
The workbook has four Excel tables. Transactions is a flat ledger export: Date, Reference, Description, Account Code, Account Name, Department and Amount, one row per line. Credit notes and refunds are negative amounts.
Budget holds Month, Account Code, Department and Amount. Account Map assigns every account code to a Report Line and Section, with a Sign of 1 for income and -1 for costs.
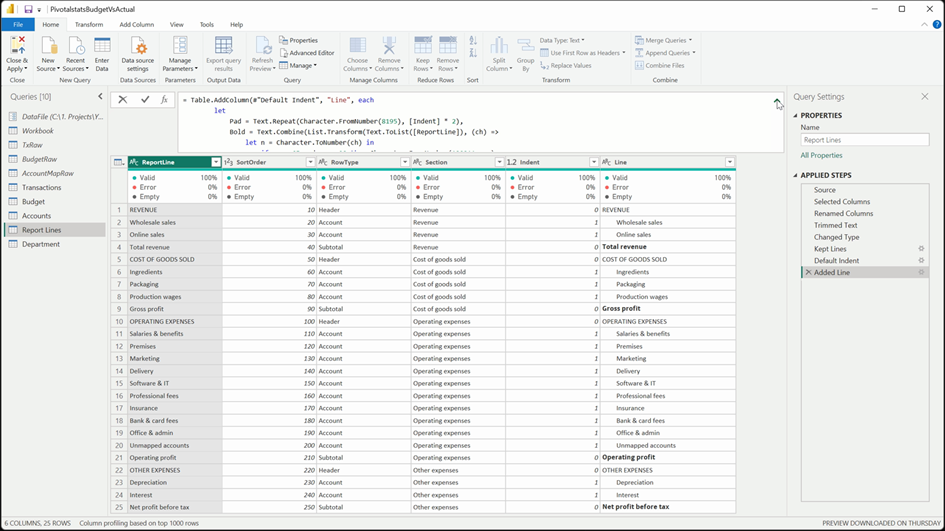
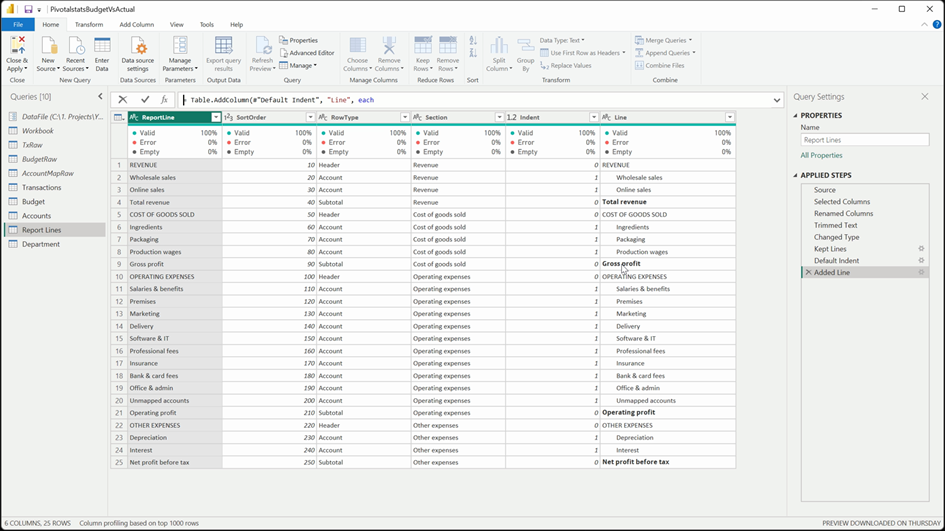
Report Lines is the layout of the P&L: Sort Order, Row Type (Header, Account or Subtotal), Section and Indent. Because the layout lives in Excel, you can rename or reorder lines without editing DAX.
Step 03: Connect with one parameter
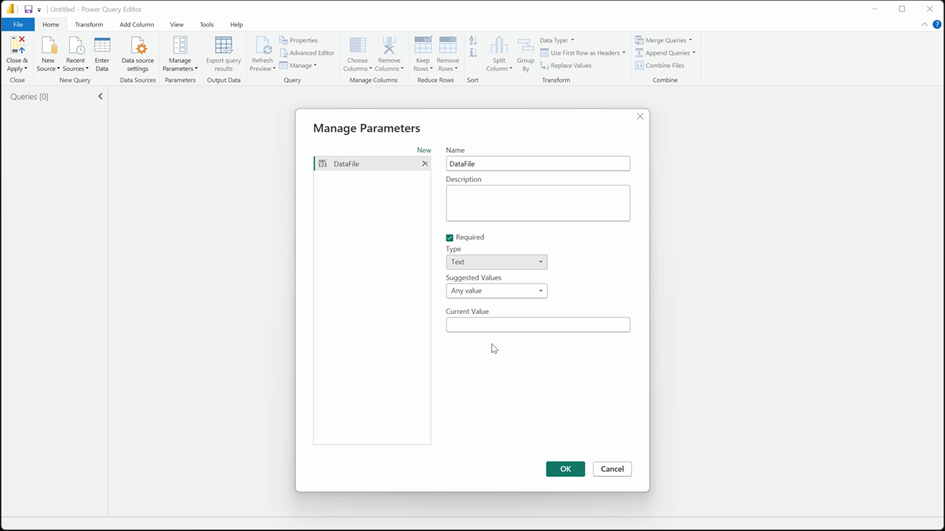
In Power Query, create a text parameter called DataFile that holds the full path to the workbook. Every query reads from it, so moving the file means changing one value.
Then add a blank query called Workbook that opens the file with Excel.Workbook. It lists the sheets and the tables; always read the tables, because they grow with your data. Don’t load this query: it is only the shared source for the queries that read each tab.
let
    Source = Excel.Workbook(File.Contents(DataFile), null, true)
in
    Source
Step 04: Clean the ledger in Power Query
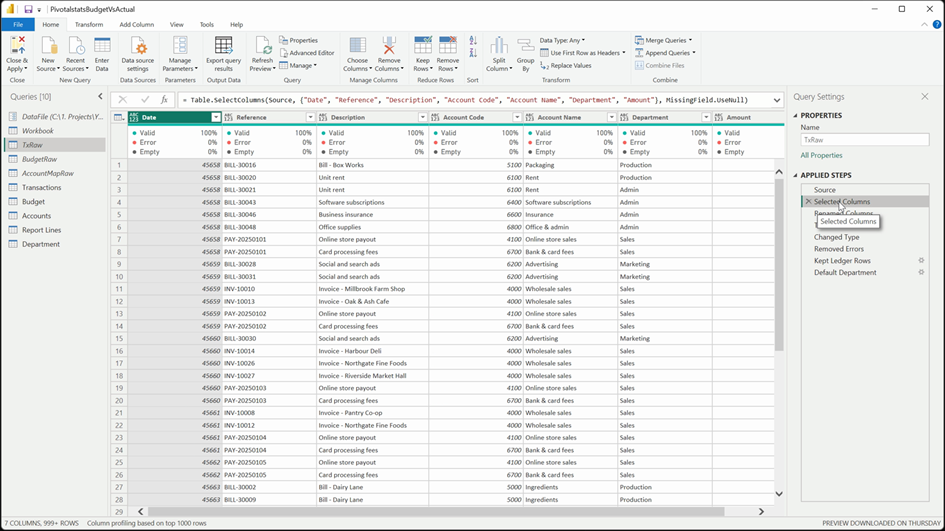
TxRaw selects the seven columns (missing ones come back empty), renames the account columns, trims all text and sets types with the en-US locale.
Two safety steps follow: Table.RemoveRowsWithErrors drops rows whose amount isn’t a number, and a row filter drops anything without a date, an amount or an account code, which removes pasted total lines and blank rows. A missing Department becomes Unassigned.
BudgetRaw uses the same pattern and moves every budget date to the first of its month with Date.StartOfMonth.
let
    Source = Workbook{[Item = "Transactions", Kind = "Table"]}[Data],
    #"Selected Columns" = Table.SelectColumns(Source, {"Date", "Reference", "Description", "Account Code", "Account Name", "Department", "Amount"}, MissingField.UseNull),
    #"Renamed Columns" = Table.RenameColumns(#"Selected Columns", {{"Account Code", "AccountCode"}, {"Account Name", "AccountName"}}),
    #"Trimmed Text" = Table.TransformColumns(#"Renamed Columns", {{"Reference", each if _ = null then null else Text.Trim(Text.From(_)), type text}, {"Description", each if _ = null then null else Text.Trim(Text.From(_)), type text}, {"AccountCode", each if _ = null then null else Text.Trim(Text.From(_)), type text}, {"AccountName", each if _ = null then null else Text.Trim(Text.From(_)), type text}, {"Department", each if _ = null then null else Text.Trim(Text.From(_)), type text}}),
    #"Changed Type" = Table.TransformColumnTypes(#"Trimmed Text", {{"Date", type date}, {"Amount", type number}}, "en-US"),
    #"Removed Errors" = Table.RemoveRowsWithErrors(#"Changed Type", {"Date", "Amount"}),
    #"Kept Ledger Rows" = Table.SelectRows(#"Removed Errors", each [Date] <> null and [Amount] <> null and [AccountCode] <> null and [AccountCode] <> ""),
    #"Default Department" = Table.ReplaceValue(#"Kept Ledger Rows", null, "Unassigned", Replacer.ReplaceValue, {"Department"})
in
    #"Default Department"
let
    Source = Workbook{[Item = "Budget", Kind = "Table"]}[Data],
    #"Selected Columns" = Table.SelectColumns(Source, {"Month", "Account Code", "Department", "Amount"}, MissingField.UseNull),
    #"Renamed Columns" = Table.RenameColumns(#"Selected Columns", {{"Account Code", "AccountCode"}}),
    #"Trimmed Text" = Table.TransformColumns(#"Renamed Columns", {{"AccountCode", each if _ = null then null else Text.Trim(Text.From(_)), type text}, {"Department", each if _ = null then null else Text.Trim(Text.From(_)), type text}}),
    #"Changed Type" = Table.TransformColumnTypes(#"Trimmed Text", {{"Month", type date}, {"Amount", type number}}, "en-US"),
    #"Removed Errors" = Table.RemoveRowsWithErrors(#"Changed Type", {"Month", "Amount"}),
    #"Kept Budget Rows" = Table.SelectRows(#"Removed Errors", each [Month] <> null and [Amount] <> null and [AccountCode] <> null and [AccountCode] <> ""),
    #"Month Start" = Table.TransformColumns(#"Kept Budget Rows", {{"Month", Date.StartOfMonth, type date}}),
    #"Default Department" = Table.ReplaceValue(#"Month Start", null, "Unassigned", Replacer.ReplaceValue, {"Department"})
in
    #"Default Department"
Step 05: Account map, unmapped codes and the layout table
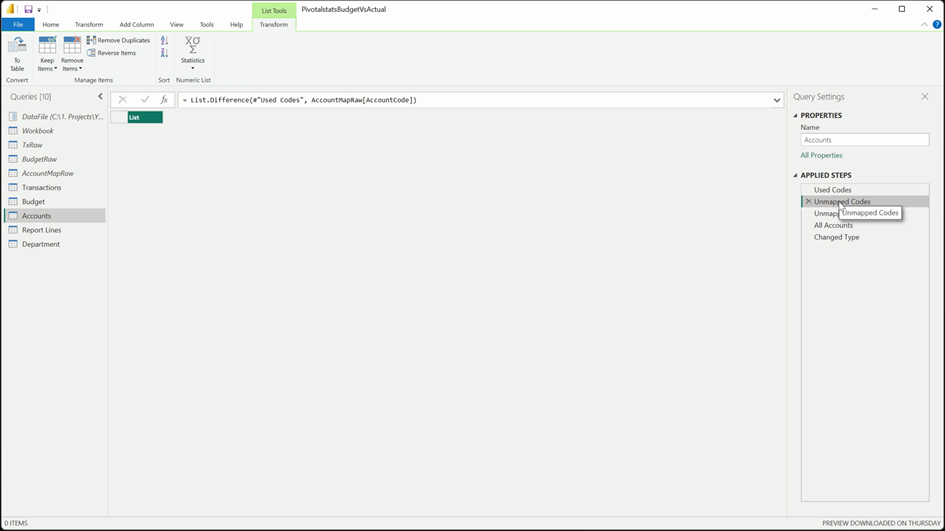
The Accounts query starts from the Account Map and adds every account code used in Transactions or Budget that isn’t mapped yet, on a Report Line called Unmapped accounts. New codes never disappear, so the P&L always reconciles.
Report Lines adds a display column, Line, that indents account lines with em spaces and writes subtotal names in Unicode bold, because the native matrix can’t bold individual rows.
Department is the distinct list of departments from both facts.
let
    #"Used Codes" = List.Distinct(List.Combine({TxRaw[AccountCode], BudgetRaw[AccountCode]})),
    #"Unmapped Codes" = List.Difference(#"Used Codes", AccountMapRaw[AccountCode]),
    #"Unmapped Rows" = Table.FromRecords(List.Transform(#"Unmapped Codes", each [AccountCode = _, AccountName = "Unmapped " & _, ReportLine = "Unmapped accounts", Section = "Operating expenses", Sign = -1])),
    #"All Accounts" = if List.IsEmpty(#"Unmapped Codes") then AccountMapRaw else Table.Combine({AccountMapRaw, #"Unmapped Rows"}),
    #"Changed Type" = Table.TransformColumnTypes(#"All Accounts", {{"AccountCode", type text}, {"AccountName", type text}, {"ReportLine", type text}, {"Section", type text}, {"Sign", Int64.Type}})
in
    #"Changed Type"
let
    Source = Workbook{[Item = "ReportLines", Kind = "Table"]}[Data],
    #"Selected Columns" = Table.SelectColumns(Source, {"Report Line", "Sort Order", "Row Type", "Section", "Indent"}, MissingField.UseNull),
    #"Renamed Columns" = Table.RenameColumns(#"Selected Columns", {{"Report Line", "ReportLine"}, {"Sort Order", "SortOrder"}, {"Row Type", "RowType"}}),
    #"Trimmed Text" = Table.TransformColumns(#"Renamed Columns", {{"ReportLine", each if _ = null then null else Text.Trim(Text.From(_)), type text}, {"RowType", each if _ = null then null else Text.Trim(Text.From(_)), type text}, {"Section", each if _ = null then null else Text.Trim(Text.From(_)), type text}}),
    #"Changed Type" = Table.TransformColumnTypes(#"Trimmed Text", {{"SortOrder", Int64.Type}, {"Indent", Int64.Type}}),
    #"Kept Lines" = Table.SelectRows(#"Changed Type", each [ReportLine] <> null and [ReportLine] <> "" and [SortOrder] <> null),
    #"Default Indent" = Table.ReplaceValue(#"Kept Lines", null, 0, Replacer.ReplaceValue, {"Indent"}),
    #"Added Line" = Table.AddColumn(#"Default Indent", "Line", each
        let
            Pad = Text.Repeat(Character.FromNumber(8195), [Indent] * 2),
            Bold = Text.Combine(List.Transform(Text.ToList([ReportLine]), (ch) =>
                let n = Character.ToNumber(ch) in
                    if n >= 65 and n <= 90 then Character.FromNumber(120211 + n)
                    else if n >= 97 and n <= 122 then Character.FromNumber(120205 + n)
                    else ch))
        in
            Pad & (if [RowType] = "Subtotal" then Bold else [ReportLine]), type text)
in
    #"Added Line"
Step 06: Model and date table
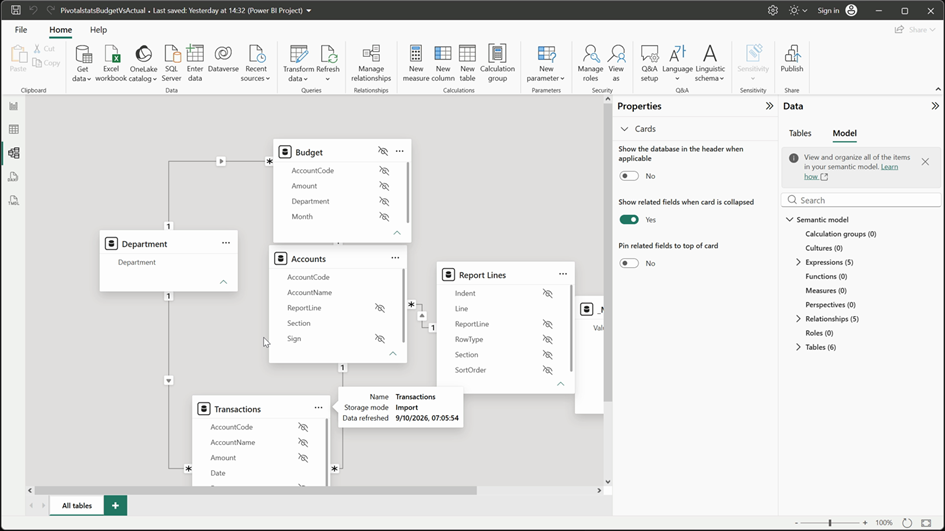
Transactions and Budget are the facts. Both relate to Accounts on AccountCode and to Department; Accounts relates to Report Lines on ReportLine, so filtering a P&L line flows through the accounts to both facts.
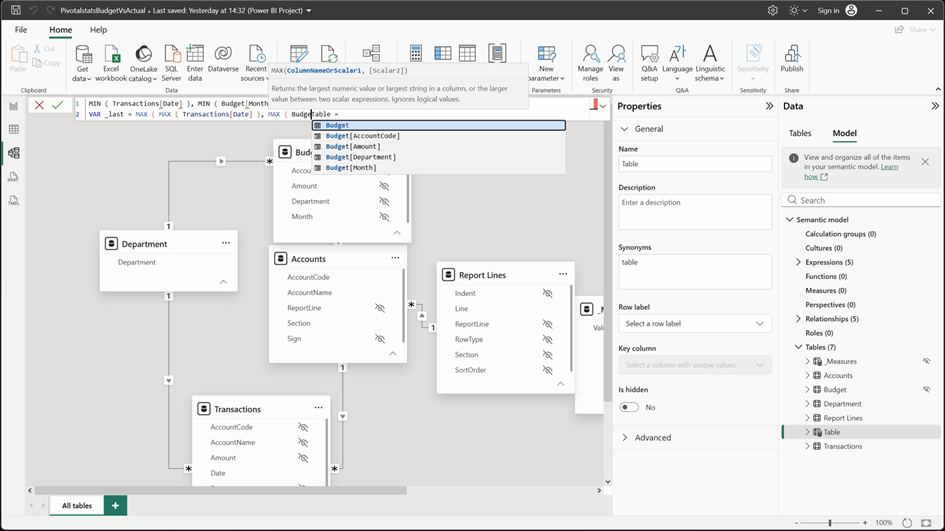
The Date table is DAX: CALENDAR from 1 January of the earliest year in either fact to 31 December of the latest (so next year’s budget is included), plus Year, MonthNum, Month, MonthStart, YearMonth and Month Year. Mark it as a date table and relate Transactions[Date] and Budget[Month] to it.
Three small tables finish the model: Period (Year to date or Month), Bridge (the steps of the profit bridge) and As Of: every month with actuals plus a Latest month row that the report opens on, so new data moves the dashboard forward by itself.
Date =
VAR _first = MIN ( MIN ( Transactions[Date] ), MIN ( Budget[Month] ) )
VAR _last = MAX ( MAX ( Transactions[Date] ), MAX ( Budget[Month] ) )
RETURN
    ADDCOLUMNS (
        CALENDAR ( DATE ( YEAR ( _first ), 1, 1 ), DATE ( YEAR ( _last ), 12, 31 ) ),
        "Year", YEAR ( [Date] ),
        "MonthNum", MONTH ( [Date] ),
        "Month", FORMAT ( [Date], "mmm", "en-US" ),
        "MonthStart", DATE ( YEAR ( [Date] ), MONTH ( [Date] ), 1 ),
        "YearMonth", YEAR ( [Date] ) * 100 + MONTH ( [Date] ),
        "Month Year", FORMAT ( [Date], "mmm yyyy", "en-US" )
    )
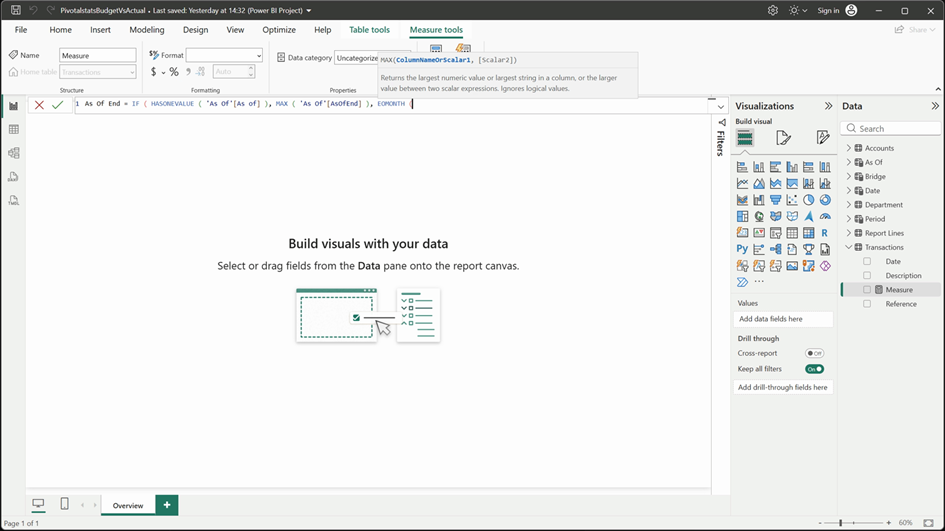
As Of =
VAR _first = MIN ( Transactions[Date] )
VAR _last = MAX ( Transactions[Date] )
RETURN
    UNION (
        ROW ( "As of", "Latest month", "AsOfEnd", EOMONTH ( _last, 0 ), "AsOfSort", -999999 ),
        SELECTCOLUMNS (
            FILTER (
                SUMMARIZE ( 'Date', 'Date'[YearMonth], 'Date'[Month Year], 'Date'[MonthStart] ),
                'Date'[MonthStart] >= DATE ( YEAR ( _first ), MONTH ( _first ), 1 ) && 'Date'[MonthStart] <= _last
            ),
            "As of", 'Date'[Month Year],
            "AsOfEnd", EOMONTH ( 'Date'[MonthStart], 0 ),
            "AsOfSort", - 'Date'[YearMonth]
        )
    )
Step 07: Three DAX user-defined functions
Every variance uses the same logic, so it lives in three DAX user-defined functions, created in DAX query view with DEFINE FUNCTION and Update model with changes. BudgetVariance is actual minus budget; BudgetVariancePct divides by the absolute budget with DIVIDE (blank instead of an error when there is no budget); IsFavourable multiplies the variance by the line’s sign so under budget is good on costs and bad on income.
As Of End is the last day of the selected month (or the newest month with actuals), and Window Start is the first of that month or 1 January for year to date. Actual and Budget sum their amounts in that window; the Signed versions multiply each account by its Sign so subtotals add income and subtract costs.
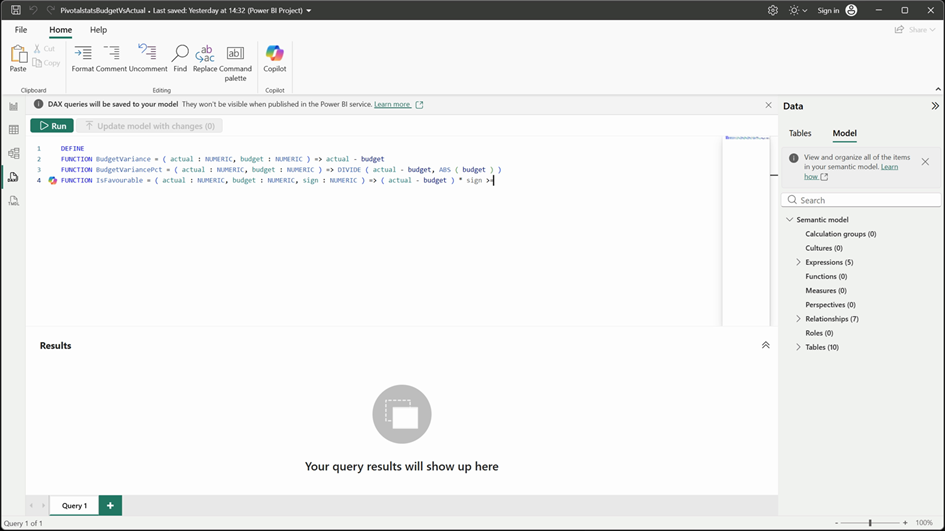
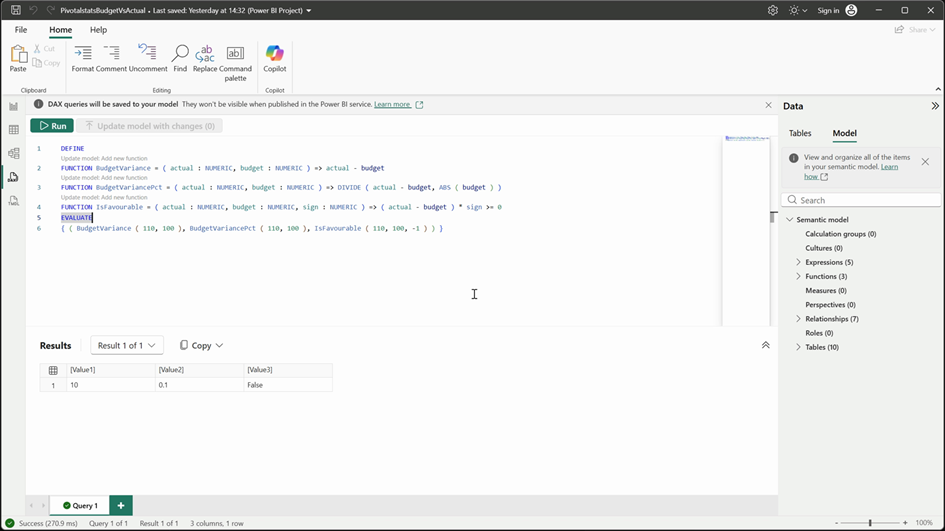
FUNCTION BudgetVariance = ( actual : NUMERIC, budget : NUMERIC ) =>
	actual - budget
FUNCTION BudgetVariancePct = ( actual : NUMERIC, budget : NUMERIC ) =>
	DIVIDE ( actual - budget, ABS ( budget ) )
FUNCTION IsFavourable = ( actual : NUMERIC, budget : NUMERIC, sign : NUMERIC ) =>
	( actual - budget ) * sign >= 0
Window Start =
VAR _e = [As Of End]
RETURN IF ( SELECTEDVALUE ( Period[Period], "Year to date" ) = "Month", DATE ( YEAR ( _e ), MONTH ( _e ), 1 ), DATE ( YEAR ( _e ), 1, 1 ) )
Actual =
VAR _e = [As Of End]
VAR _s = [Window Start]
RETURN
    CALCULATE ( [Actual Amount], REMOVEFILTERS ( 'Date' ), DATESBETWEEN ( 'Date'[Date], _s, _e ) )
Signed Actual Amount = SUMX ( VALUES ( Accounts[Sign] ), Accounts[Sign] * [Actual Amount] )Step 08: One measure for the whole P&L
P&L Actual switches on the current line’s RowType. Account lines return Actual for the mapped accounts. Subtotal lines remove the filter on Report Lines and sum Signed Actual for every line whose SortOrder is lower, so Gross profit is revenue minus cost of goods, Operating profit is everything above it, and Net profit is everything. Headers return 0.
A dynamic format string shows nothing on header rows (the format ;;;) while keeping the row visible, and accounting brackets elsewhere. P&L Budget and P&L PY use the same pattern; P&L Var and P&L Var % call the variance functions, and the Var % format includes up and down arrows.
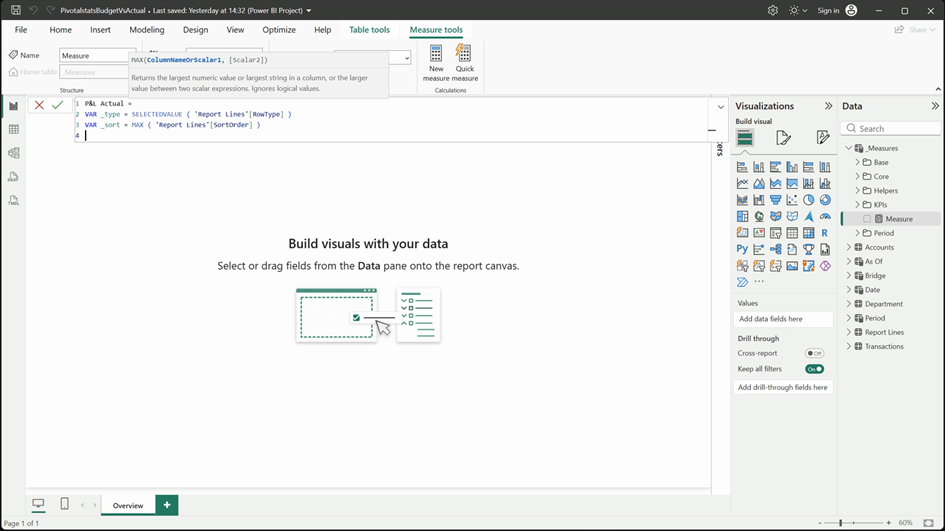
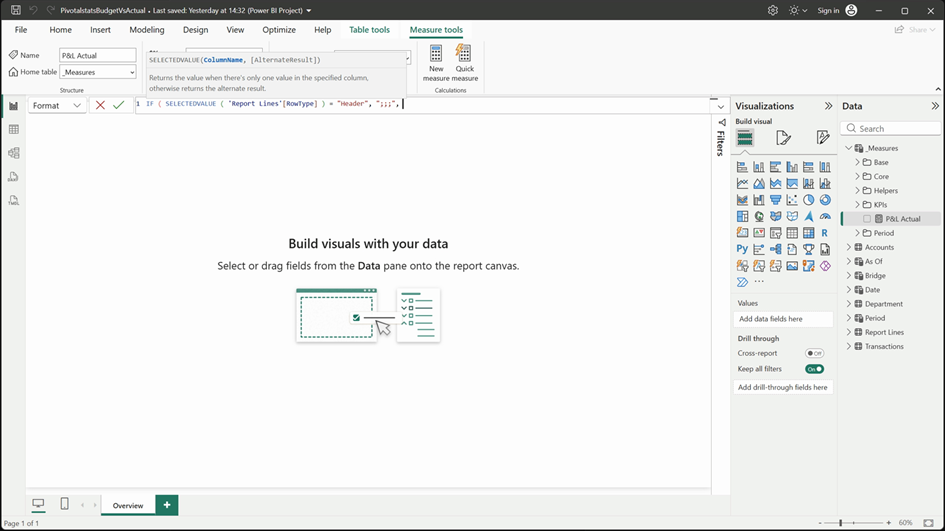
P&L Actual =
VAR _type = SELECTEDVALUE ( 'Report Lines'[RowType] )
VAR _sort = MAX ( 'Report Lines'[SortOrder] )
RETURN
    SWITCH (
        _type,
        "Account", [Actual],
        "Subtotal", CALCULATE ( [Signed Actual], REMOVEFILTERS ( 'Report Lines' ), 'Report Lines'[SortOrder] < _sort ),
        "Header", 0
    )
P&L Var = IF ( SELECTEDVALUE ( 'Report Lines'[RowType] ) = "Header", 0, BudgetVariance ( [P&L Actual], [P&L Budget] ) )P&L Var % = IF ( SELECTEDVALUE ( 'Report Lines'[RowType] ) = "Header", 0, BudgetVariancePct ( [P&L Actual], [P&L Budget] ) )Step 09: A finance-paper design
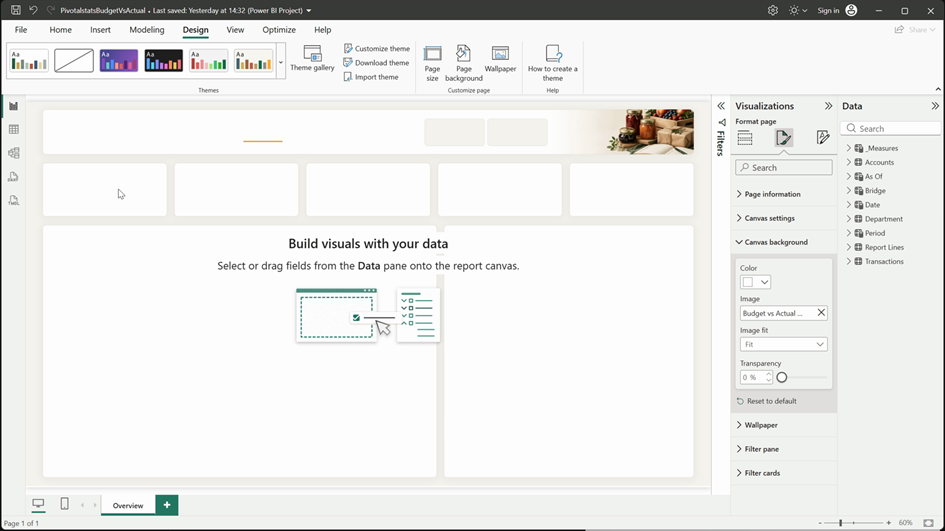
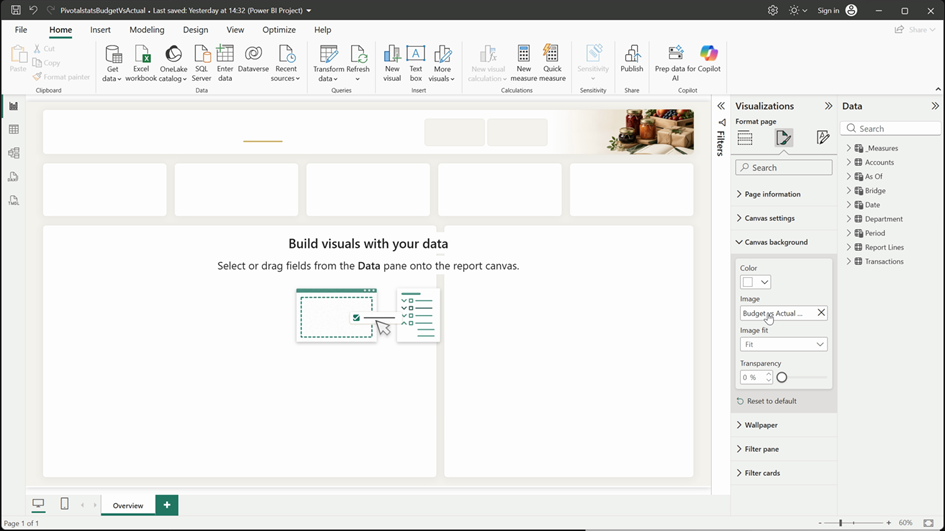
The cards, shadows, tab underline and header illustration are one 1920×1080 background image: Format page > Canvas background, transparency 0%, image fit Fit. A JSON theme (Design > Import theme) sets colours, fonts and table and chart defaults.
Only neutral shapes live in the background; the logo, title and subtitle are separate objects, so the report is easy to rebrand. The Period and As of slicers are single select.
Step 10: SVG tiles and rounded bars
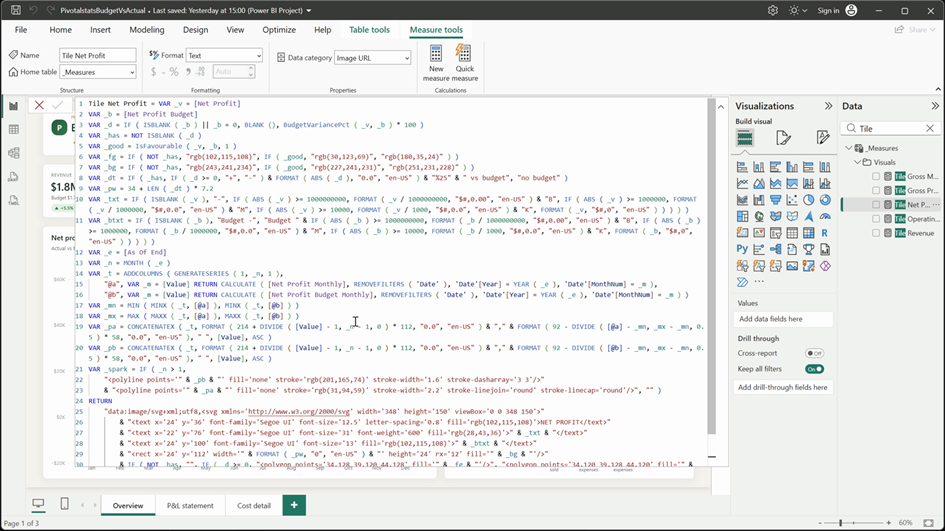
Each tile is a DAX measure that returns an SVG image as text (label, value, budget, a variance pill coloured by IsFavourable and a sparkline of actual against budget). Set the measure’s Data category to Image URL and show it in a standard Image visual.
The Net profit by month chart is a line and clustered column chart. Rounded columns come from native error bars (lower bound a zero measure, upper bound the value, bar width as wide as the column, circle marker); the real columns are painted white. Trend Actual Zero is blank after the reporting month, so no empty caps appear.
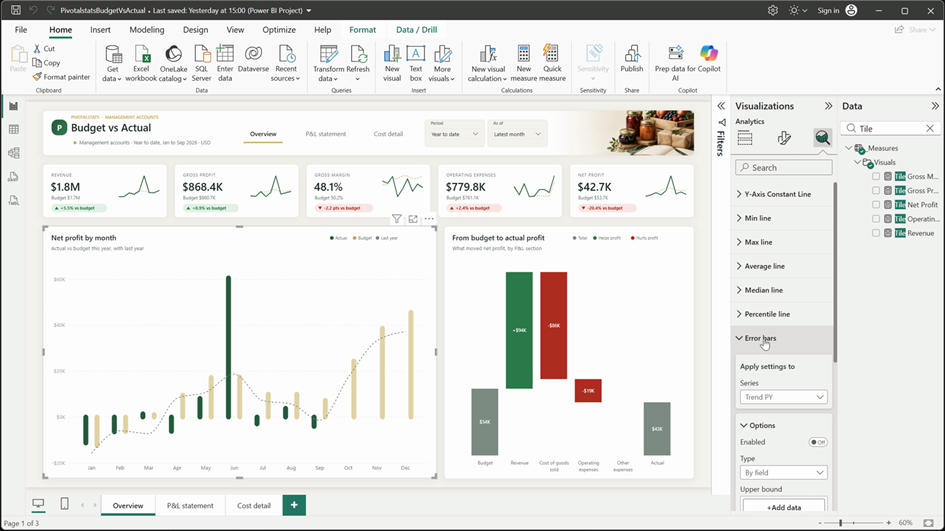
Trend Actual =
VAR _e = [As Of End]
VAR _m = MAX ( 'Date'[MonthNum] )
RETURN
    IF ( _m <= MONTH ( _e ) && HASONEVALUE ( 'Date'[MonthNum] ),
        CALCULATE ( [Net Profit Monthly], REMOVEFILTERS ( 'Date' ), 'Date'[Year] = YEAR ( _e ) - 0, 'Date'[MonthNum] = _m ) )
Trend Actual Zero = IF ( NOT ISBLANK ( [Trend Actual] ), 0 )Step 11: A bridge that works with losses
The bridge is a stacked column chart on the Bridge table. Bridge Delta is how much each P&L section moved net profit against budget; Bridge Before is the running total so far; the invisible Bridge Base is the lower of each step’s start and end. Green Bridge Up and red Bridge Down show the movement, and grey totals show budget and actual net profit.
When profit drops below zero, stacked columns would stack from the axis in the wrong place, so Bridge Offset lifts every bar by the depth of the lowest running total. The value axis is hidden, and the labels take their sign from the format strings (+ and -).
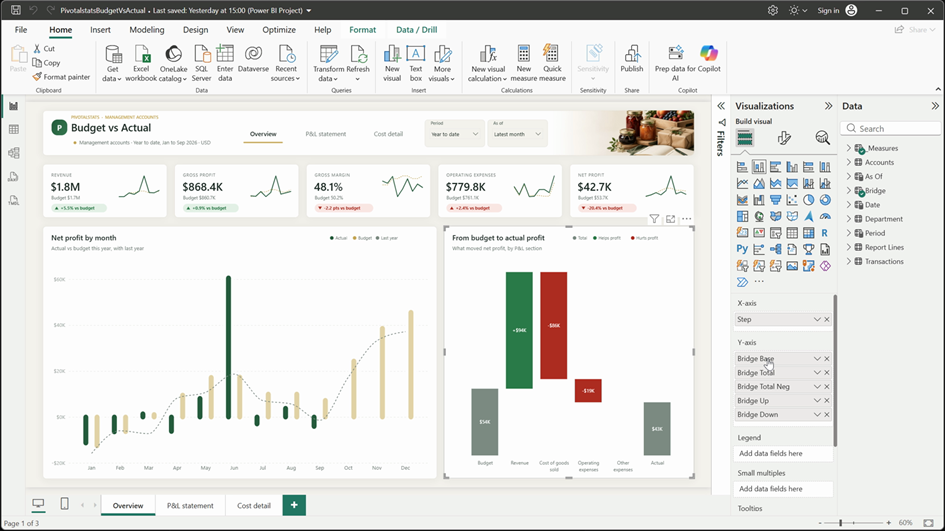
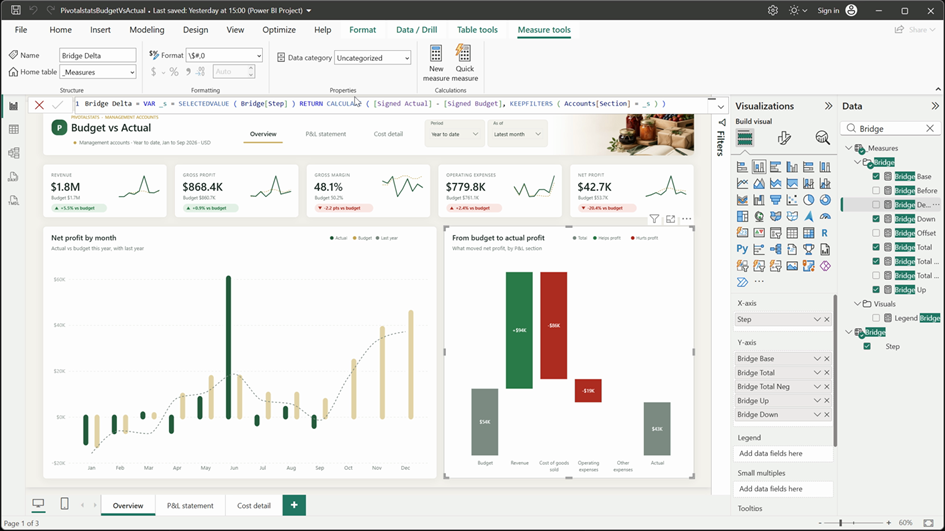
Bridge Delta = VAR _s = SELECTEDVALUE ( Bridge[Step] ) RETURN CALCULATE ( [Signed Actual] - [Signed Budget], KEEPFILTERS ( Accounts[Section] = _s ) )Bridge Offset =
VAR _b = [Net Profit Budget]
VAR _low = MINX ( FILTER ( ALL ( Bridge ), Bridge[StepSort] > 1 && Bridge[StepSort] < 6 ), [Bridge Before] + [Bridge Delta] )
RETURN MAX ( 0, - MIN ( _b, _low ) )
Bridge Base =
VAR _k = SELECTEDVALUE ( Bridge[StepSort] )
VAR _b = [Bridge Before]
VAR _t = [Bridge Total Value]
RETURN
    [Bridge Offset] + IF ( _k > 1 && _k < 6, MIN ( _b, _b + [Bridge Delta] ), MIN ( 0, _t ) )
Step 12: Formatting the P&L matrix
Add a matrix with Report Lines[Line] on rows and P&L Actual, P&L Budget, P&L Var, P&L Var % and P&L PY as values (renamed in the visual). Line is sorted by SortOrder, so rows follow the layout table. Turn off the matrix subtotals: the subtotal lines are already part of the layout. Under Cell elements, colour the Variance and Var % fonts by field value with P&L Var Color, which calls IsFavourable with the line’s sign. Shade subtotal rows with a background colour by field value using P&L Row Back.
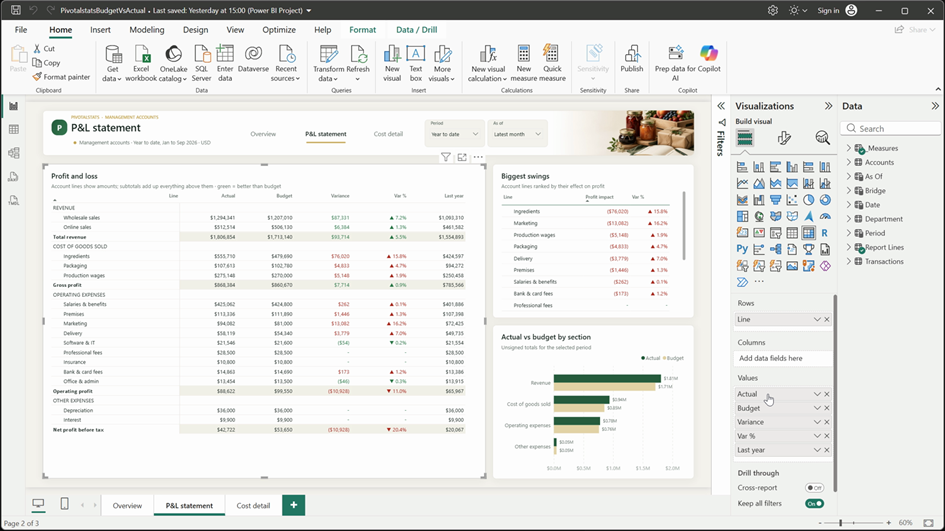
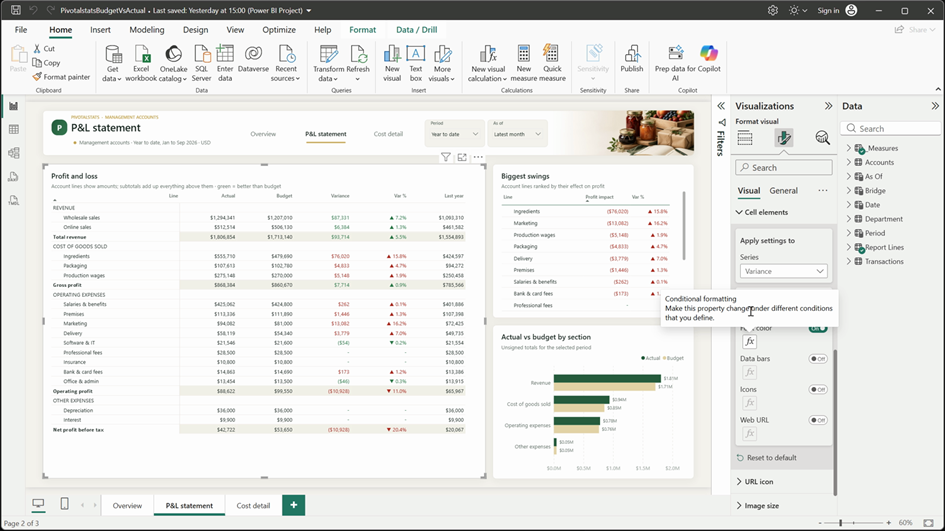
P&L Var Color =
IF ( SELECTEDVALUE ( 'Report Lines'[RowType] ) = "Header" || ( ISBLANK ( [P&L Actual] ) && ISBLANK ( [P&L Budget] ) ), "#1C2B24",
    IF ( IsFavourable ( [P&L Actual], [P&L Budget], [P&L Sign] ), "#1E7B45", "#B42318" ) )
P&L Row Back = IF ( SELECTEDVALUE ( 'Report Lines'[RowType] ) = "Subtotal", "#F3F1EA", "#FFFFFF" )Step 13: Reading the story
The cost page shows the ten biggest cost variances (Cost Variance Top ranks accounts with RANKX), a department-by-month heat grid of cost variance, the last 12 months of costs against the year before, and the cost budget left this year by department.
In the sample data, ingredients run about $76K over budget from April, a summer marketing campaign overspends in July to September, and gross margin ends more than two points under budget: revenue beat budget, but margins missed it.
Cost Variance Top =
VAR _v = [Cost Variance]
RETURN IF ( NOT ISBLANK ( _v ) && RANKX ( ALLSELECTED ( Accounts[AccountName] ), ABS ( [Cost Variance] ), , DESC, Dense ) <= 10, _v )
Heat Var % =
VAR _e = [As Of End]
VAR _m = MAX ( 'Date'[MonthNum] )
RETURN
    IF ( HASONEVALUE ( 'Date'[MonthNum] ) && _m <= MONTH ( _e ),
        BudgetVariancePct (
            CALCULATE ( [Total Cost Monthly], REMOVEFILTERS ( 'Date' ), 'Date'[Year] = YEAR ( _e ), 'Date'[MonthNum] = _m ),
            CALCULATE ( [Total Cost Budget Monthly], REMOVEFILTERS ( 'Date' ), 'Date'[Year] = YEAR ( _e ), 'Date'[MonthNum] = _m ) ) )
Step 14: The monthly routine
Each month, paste the new export rows under the Transactions table, save the workbook and click Refresh in Power BI. Because the As of slicer opens on Latest month, the report moves to the new month without touching a slicer.
Wrap-up
You’ve now built a complete budget versus actual dashboard: Power Query with a single file-path parameter and forgiving queries, a small star schema with a DAX date table, three DAX user-defined functions, one switching measure for the whole P&L, and a printed-report design using only standard visuals.
If you’d rather start from the finished file, the ready-made template includes the dashboard, the Excel workbook and a step-by-step setup guide.
Prefer the ready-made template? Get Budget vs Actual for $19, with the dashboard, the Excel file and a step-by-step guide: https://pivotalstats.gumroad.com/l/budget-vs-actual-power-bi
More dashboards: https://www.youtube.com/@PivotalstatsProjects · https://pivotalstats.com