Log your shifts in Excel, click Refresh, and see where your machine hours and good parts go.
Manufacturing OEE is a Power BI dashboard for plant managers, operations and continuous-improvement leads, and small manufacturers who log production, stops and scrap by shift. Fill one Excel workbook, click Refresh, and you get OEE against a target, where the downtime comes from, and which machines, shifts and products scrap the most.
It answers the questions a production meeting needs: are we hitting our OEE target, which machine is losing the most time, is it breakdowns, changeovers or slow running, how much is it costing, and does the night shift do something differently.

The finished Manufacturing OEE dashboard
Prefer the ready-made template? Get Manufacturing OEE for $19, with the dashboard, the Excel file and a step-by-step guide: Click to Buy
Watch the full build on YouTube: https://www.youtube.com/@PivotalstatsProjects (Click to Watch)
What you need
- Power BI Desktop from Microsoft (Windows), 2025 or newer
- Microsoft Excel
- The sample data file Production Log.xlsx: Click to Download
What you’ll build
A manufacturing production and OEE dashboard in Power BI, built from one Excel workbook: OEE as availability x performance x quality against a target, unplanned downtime and its reasons, a waterfall from planned time to productive time, a downtime heat map by machine and month, scrap by reason, shift and product, and the cost of every loss.
It uses Power Query, a small star model with three fact tables, a DAX date table, DAX measures and only Microsoft’s standard visuals. The OEE gauge, the cards, bars and heat map are SVG measures, and the logo, icons and illustrations are separate objects you can replace.
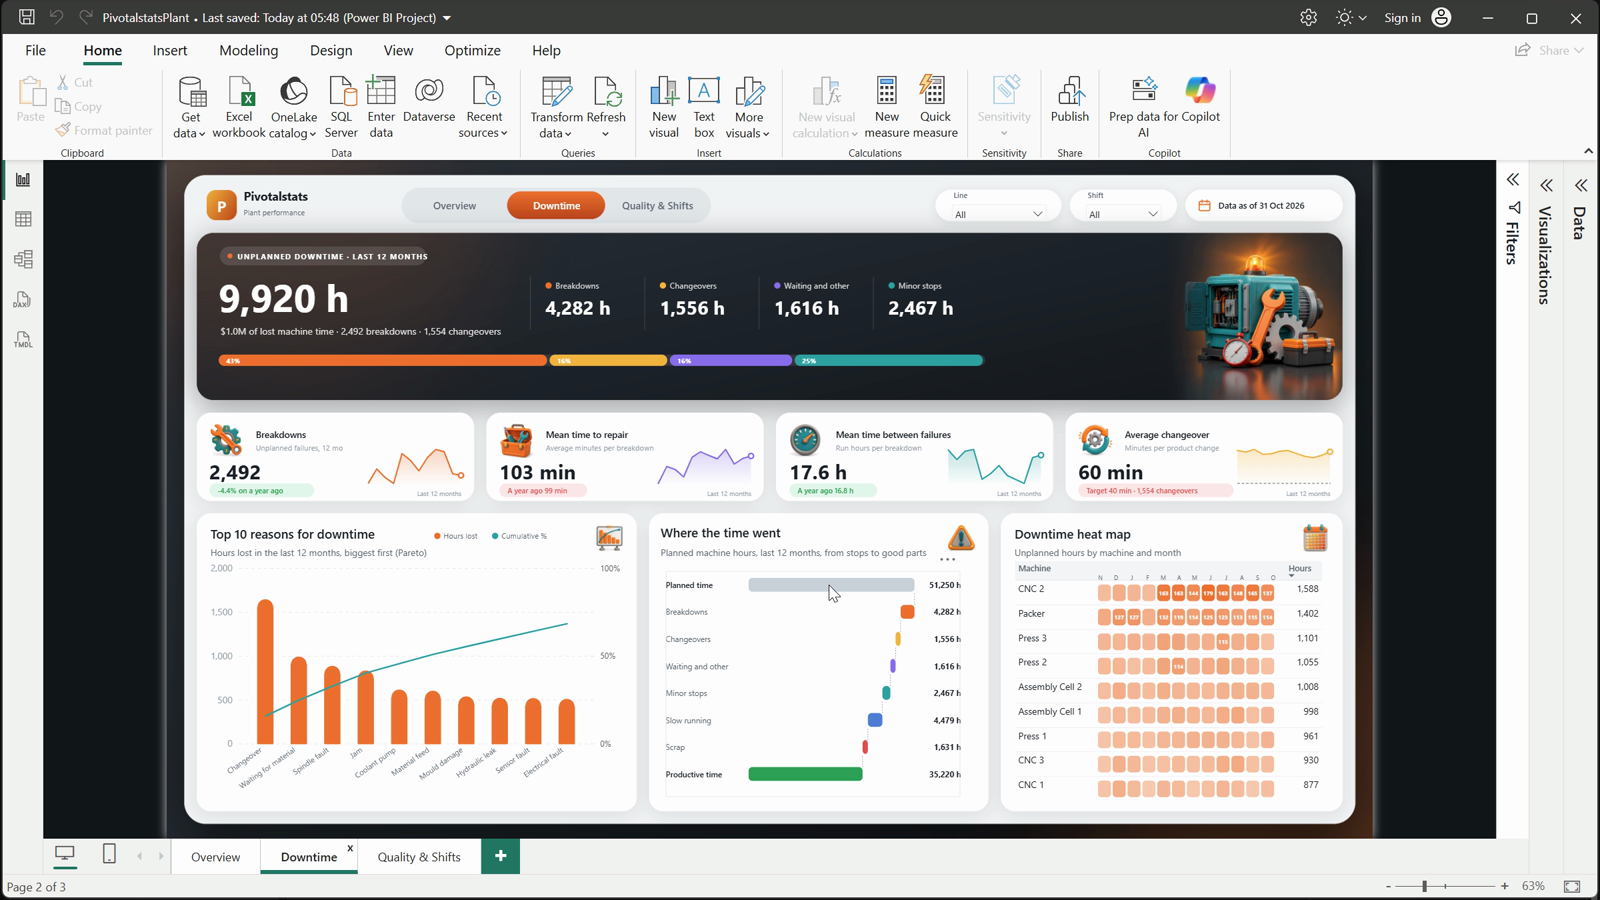
51,250 planned hours
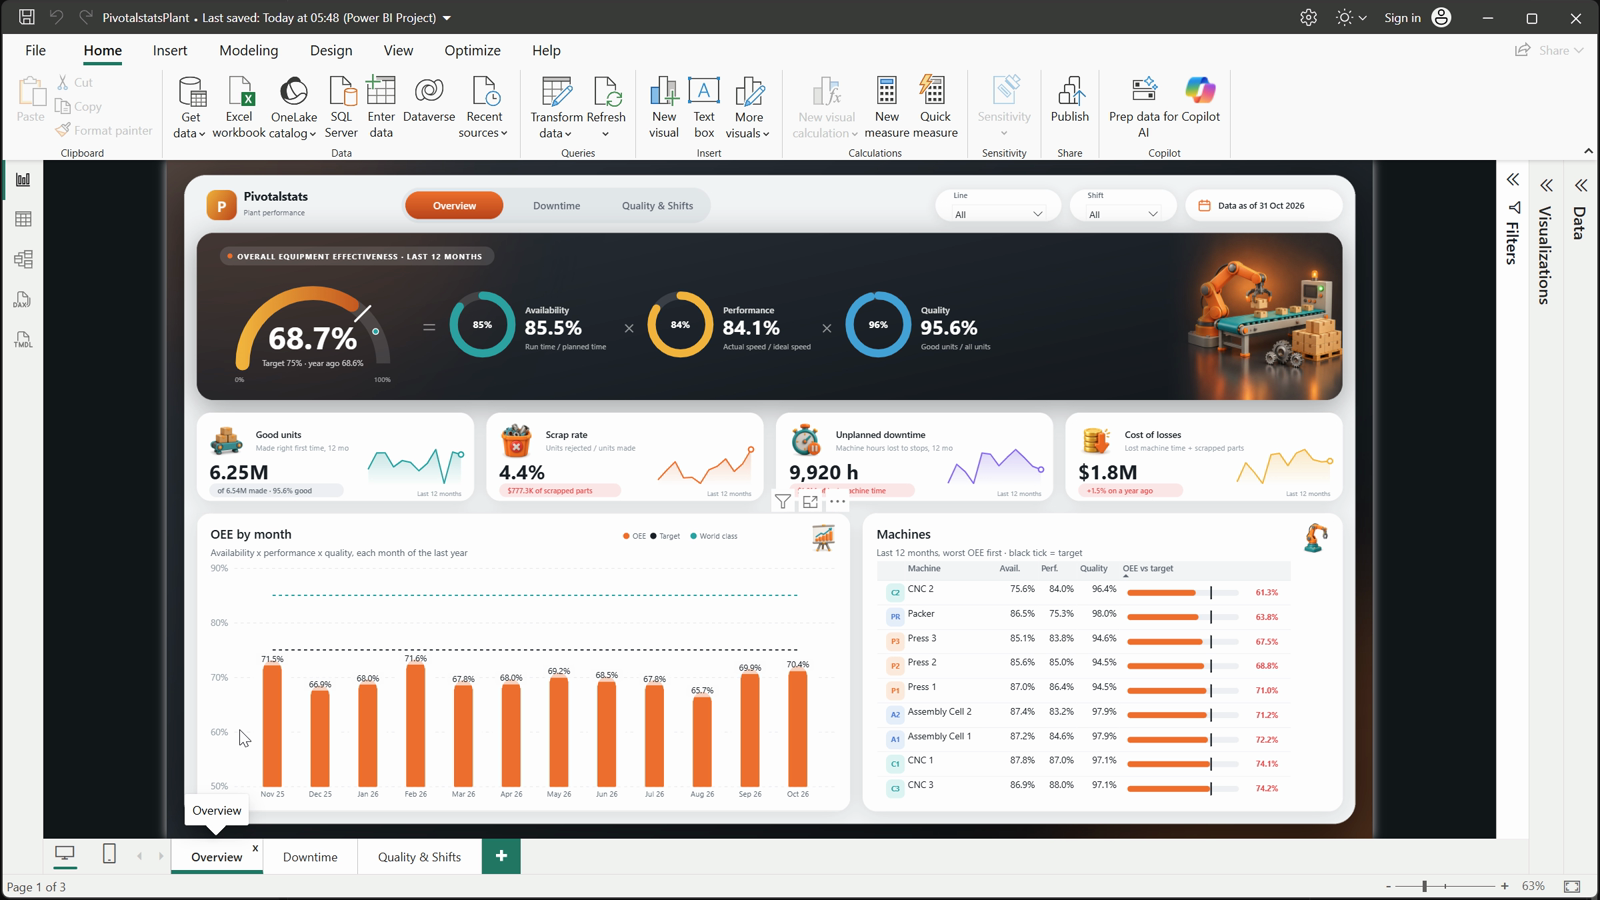
OEE 68.7%
Step 01: The three pages
Overview: the OEE console (a gauge for OEE against the target and world class, and rings for availability, performance and quality), cards for good units, scrap rate, unplanned downtime and the cost of losses, OEE by month, and every machine ranked by OEE.
Downtime: the hours lost by kind, the top ten reasons as a Pareto chart, a waterfall from planned time to productive time, and a heat map of downtime by machine and month. Quality & Shifts: scrap by reason, scrap rate by shift, day and night by line, and scrap by product. The Line and Shift slicers filter every page.
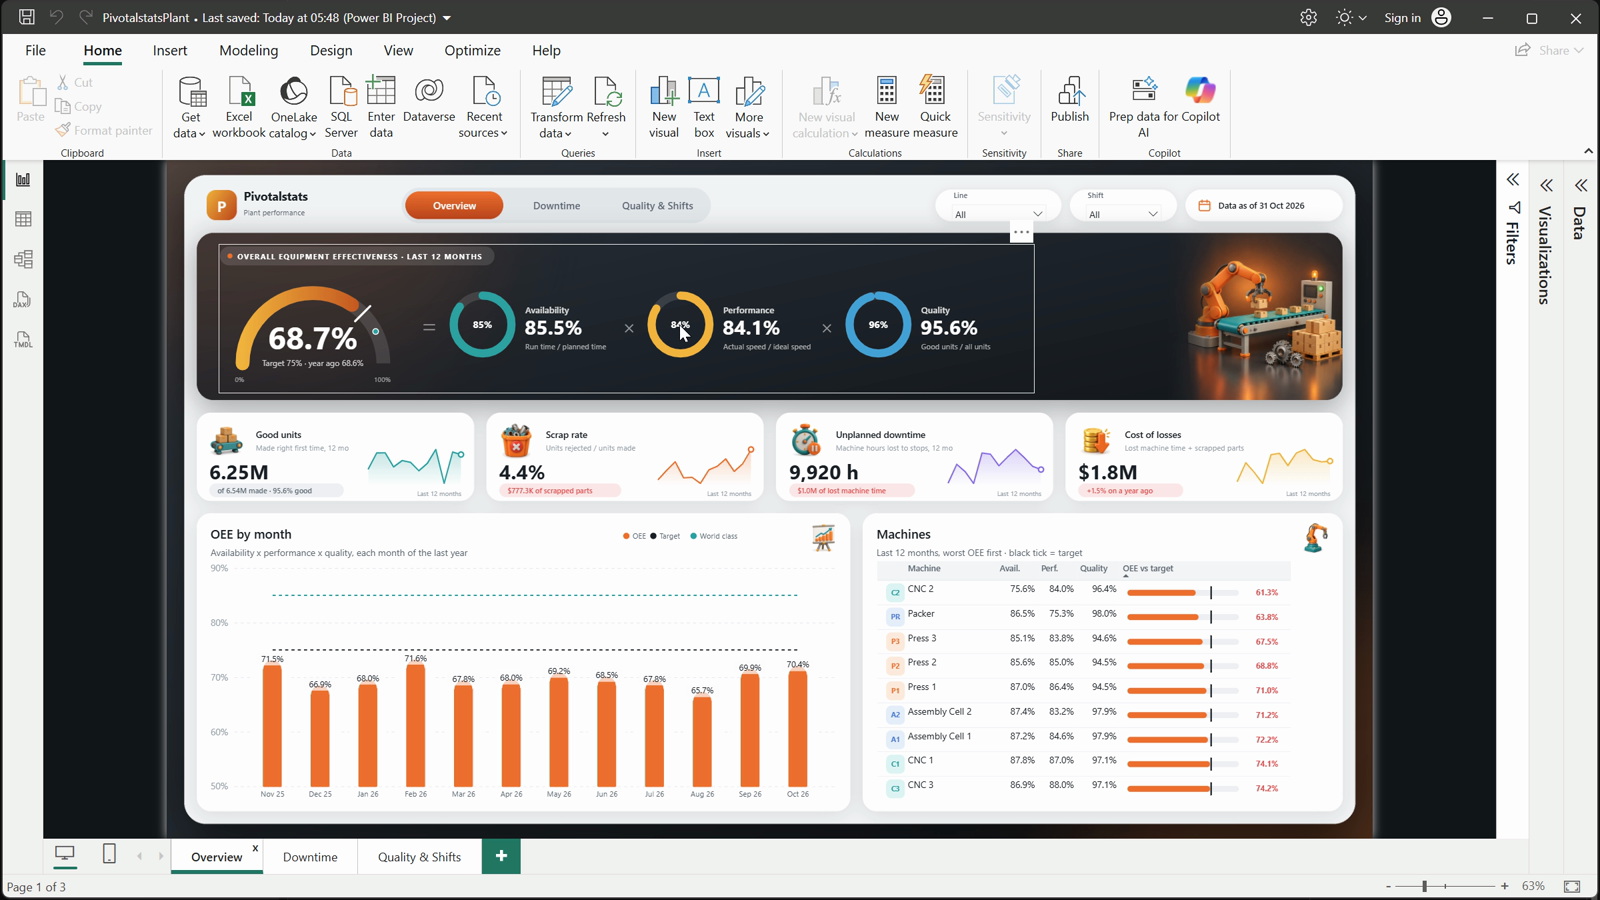
OEE = A x P x Q
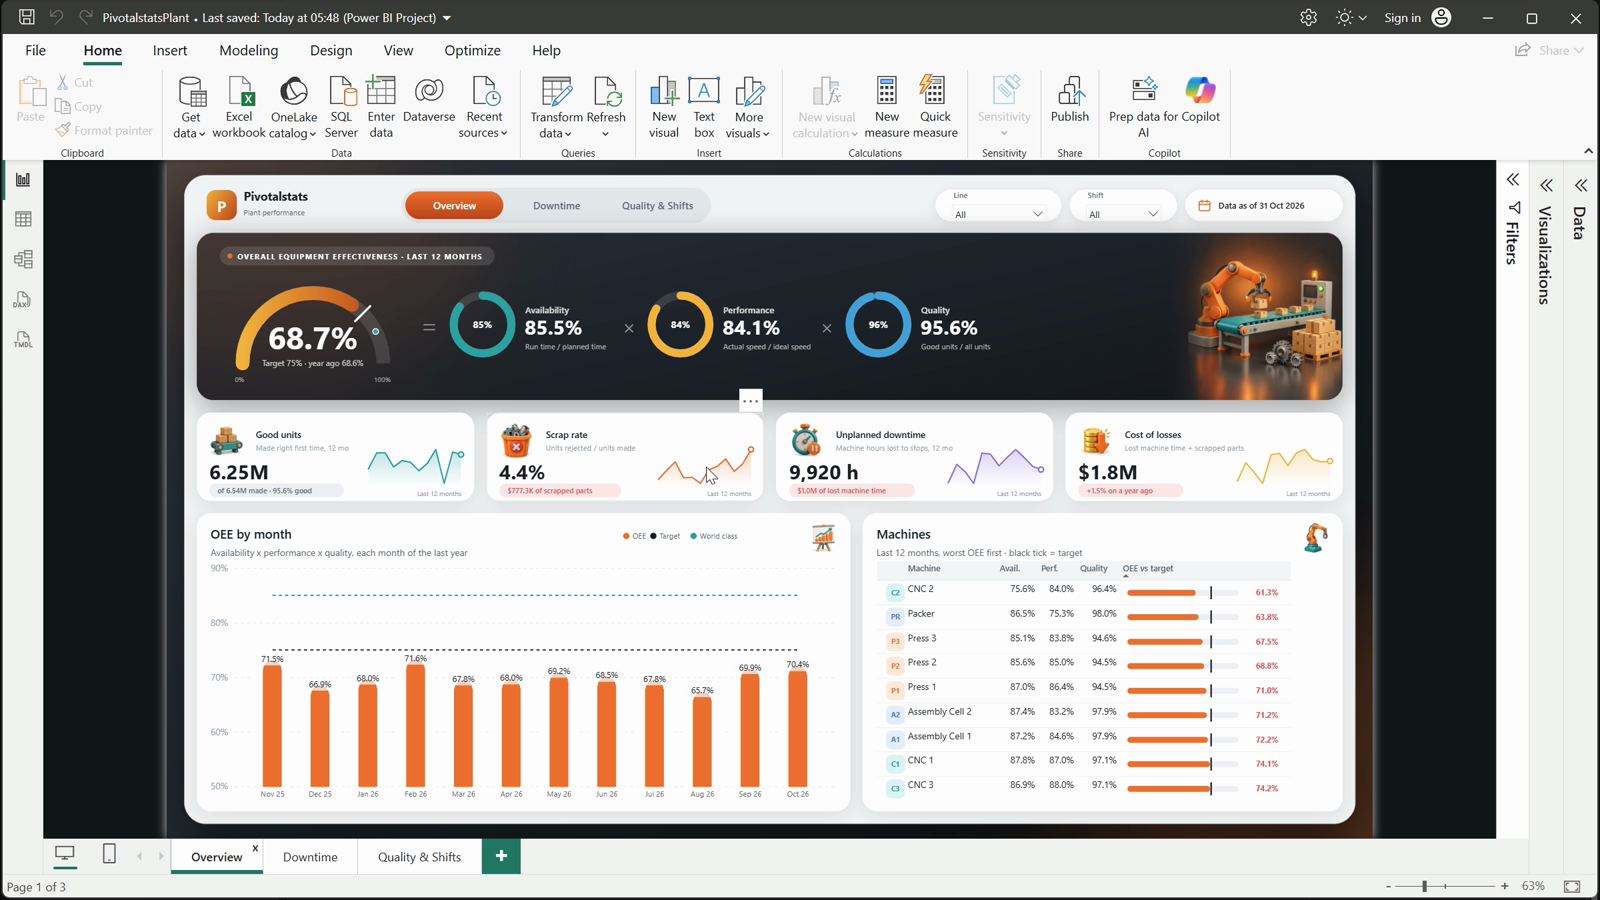
Four KPI cards
Step 02: The workbook: one shift log, two loss logs and three small lists
Production is one row per machine per shift: Date, Shift, Machine ID, Product, Planned Minutes (the shift length minus breaks), Total Units and Good Units. Downtime is one row per stop with Minutes, Reason and a Category (Breakdown, Changeover, Waiting, Minor stop or Planned). Scrap holds rejected units by Reason and Stage (Startup after a changeover, or Production).
Machines lists each Machine ID with its Line and the Hourly Cost of lost time; Products holds the Ideal Units per Hour and the Unit Cost; Setup holds the Report Date, the OEE Target and the Changeover Target. Every tab is an Excel table, so pasted rows are picked up on the next refresh.
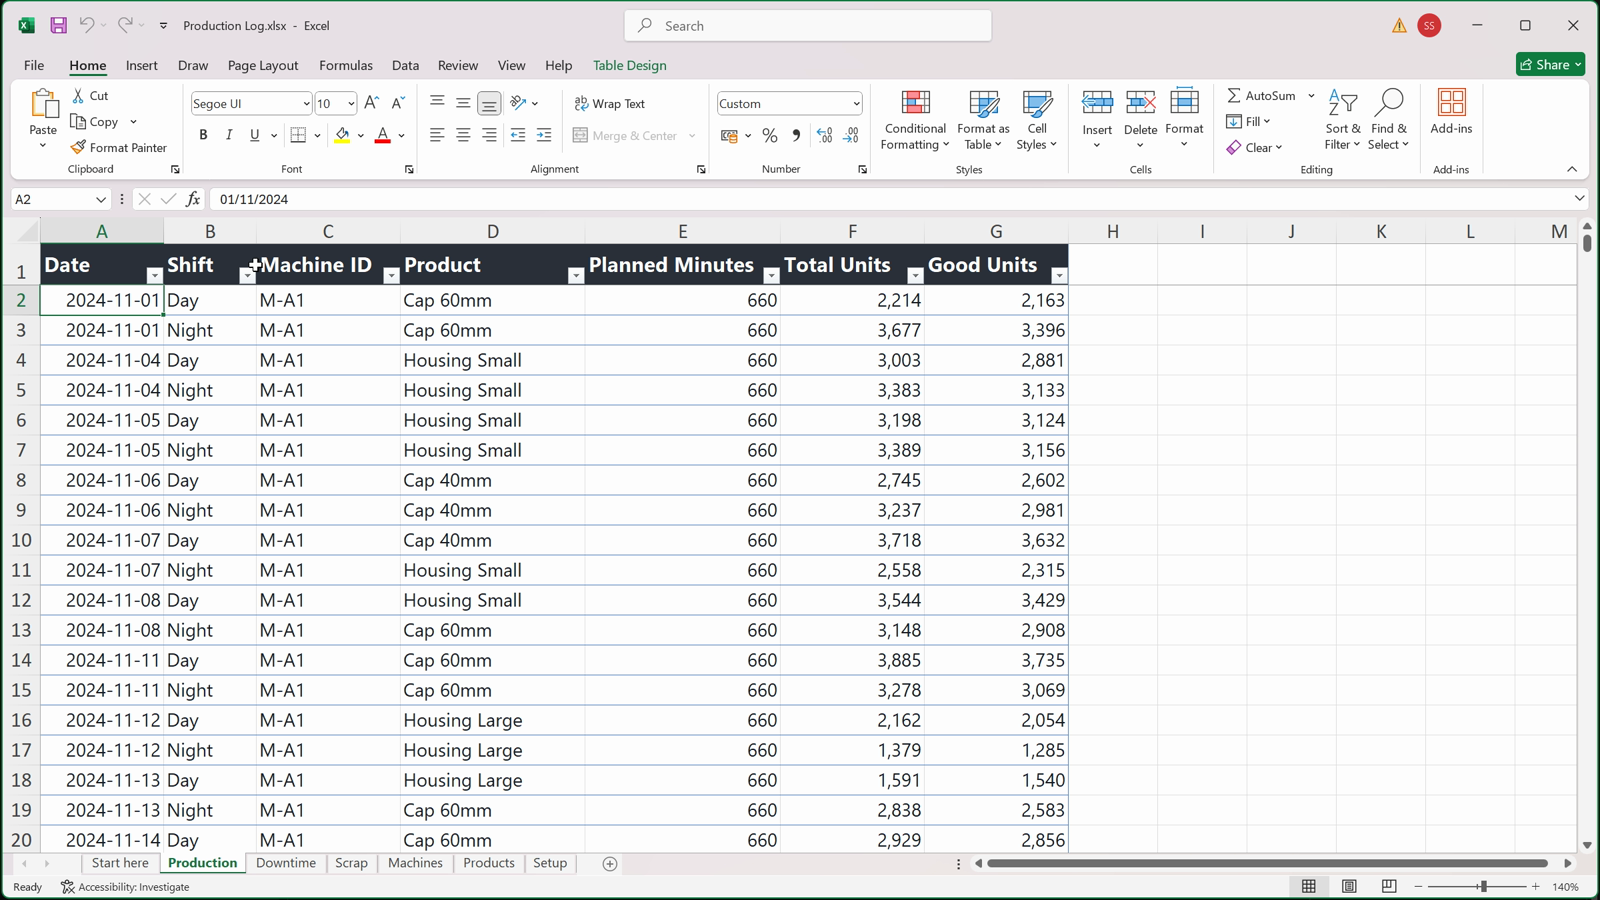
Production
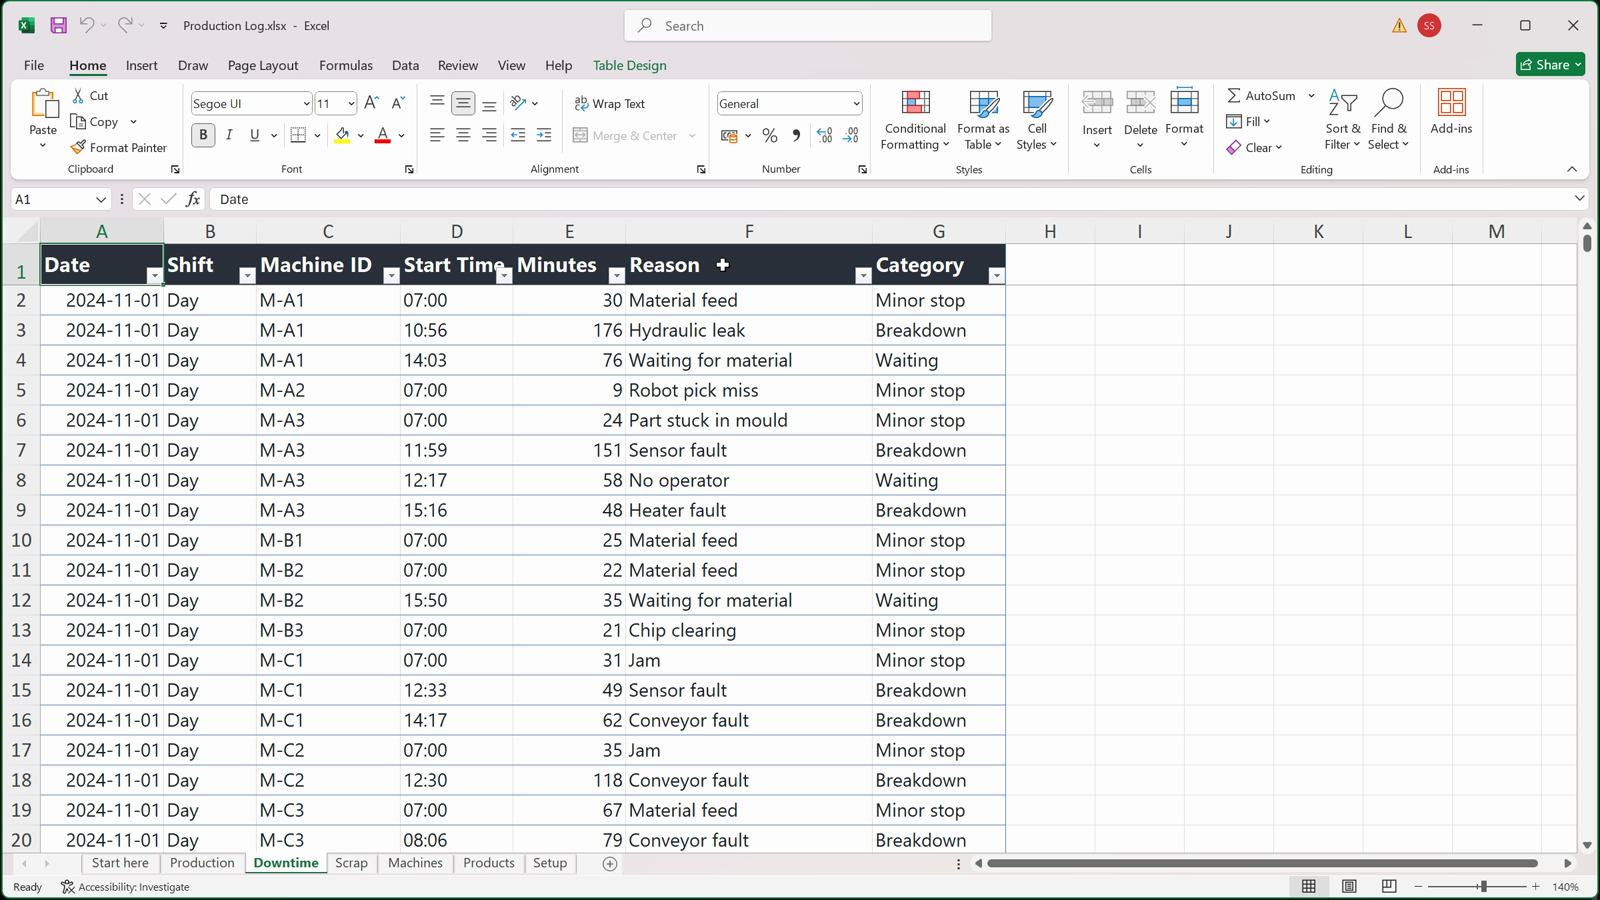
Downtime
Step 03: Connect once, through a parameter
A text parameter, DataFile, holds the full path to the workbook. A blank query called Workbook opens it with Excel.Workbook and lists every sheet and table; the other queries start from it and read the tables, not the sheets. Workbook itself has Enable load switched off.
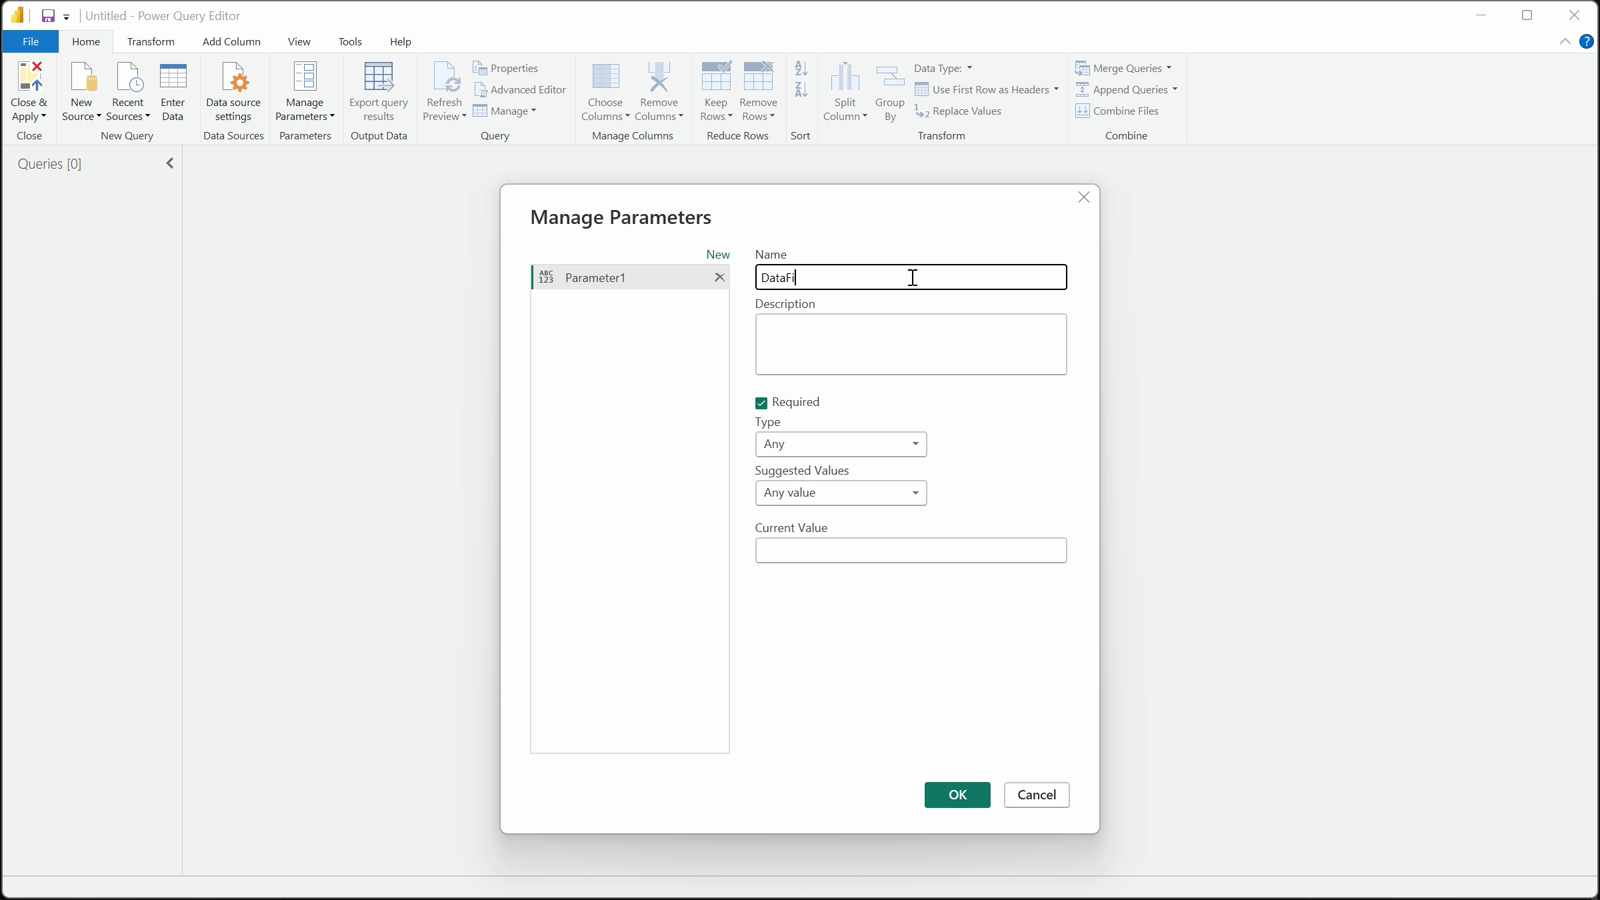
DataFile parameter
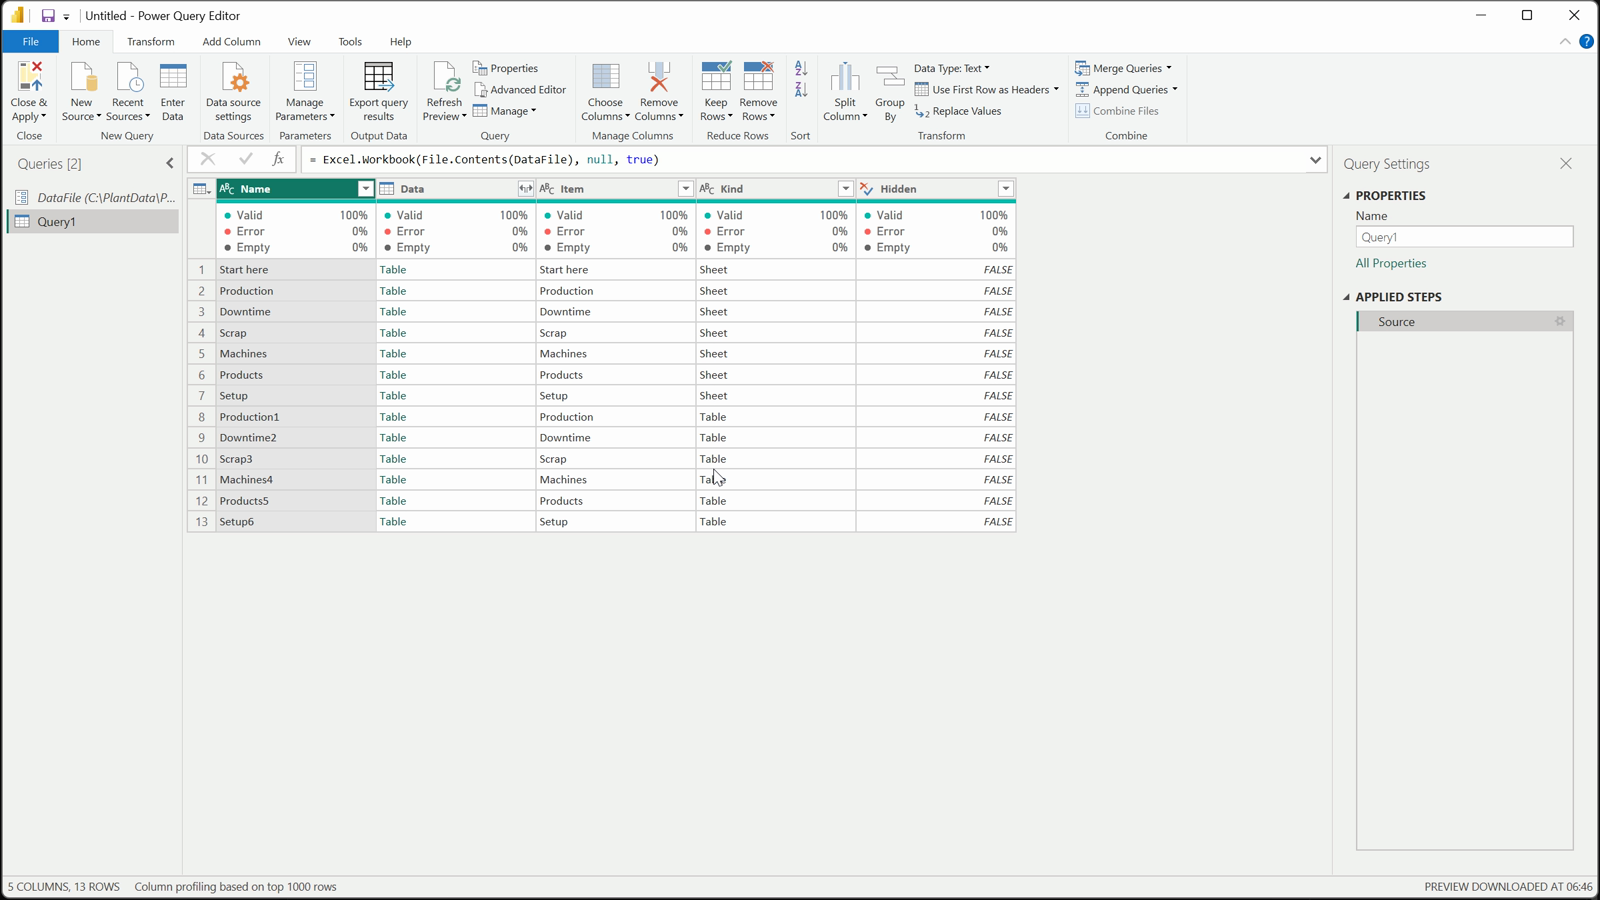
Read the tables
M
let

Source = Excel.Workbook(File.Contents(DataFile), null, true)

in

Source
Step 04: Clean the shift log
ProductionRaw selects its seven columns with MissingField.UseNull (a missing column arrives empty), renames them, trims the text and types the date and numbers. Rows whose date or numbers fail to convert are removed, and only rows with a date and a Machine ID are kept.
Blank shifts become Unassigned, a blank product becomes Unknown product, and empty minutes and counts become zero.
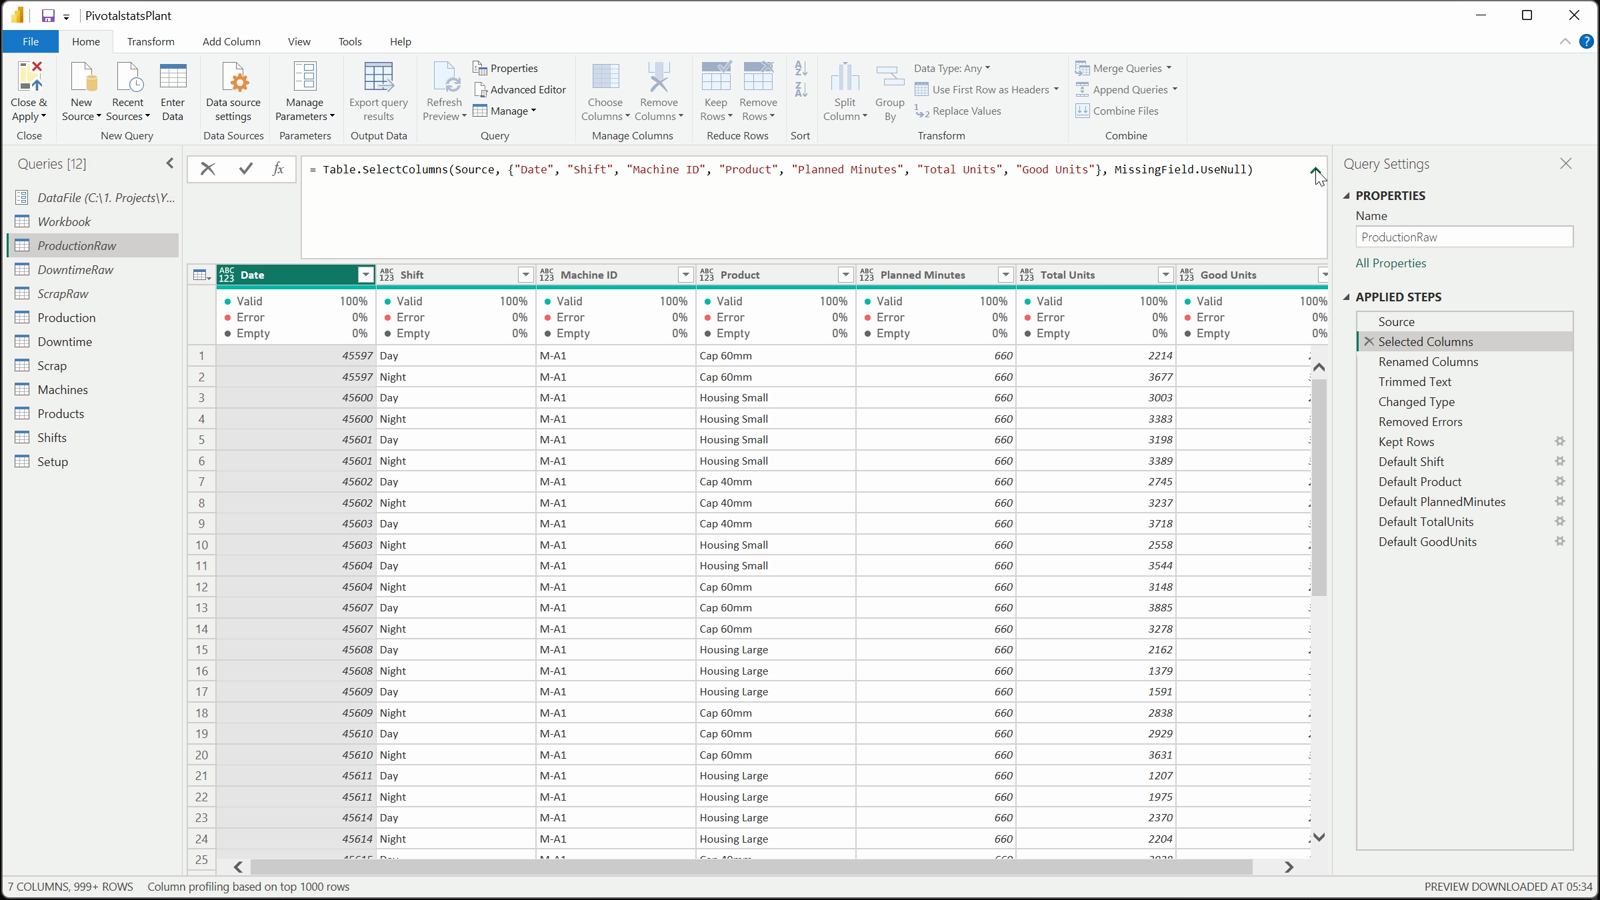
MissingField.UseNull
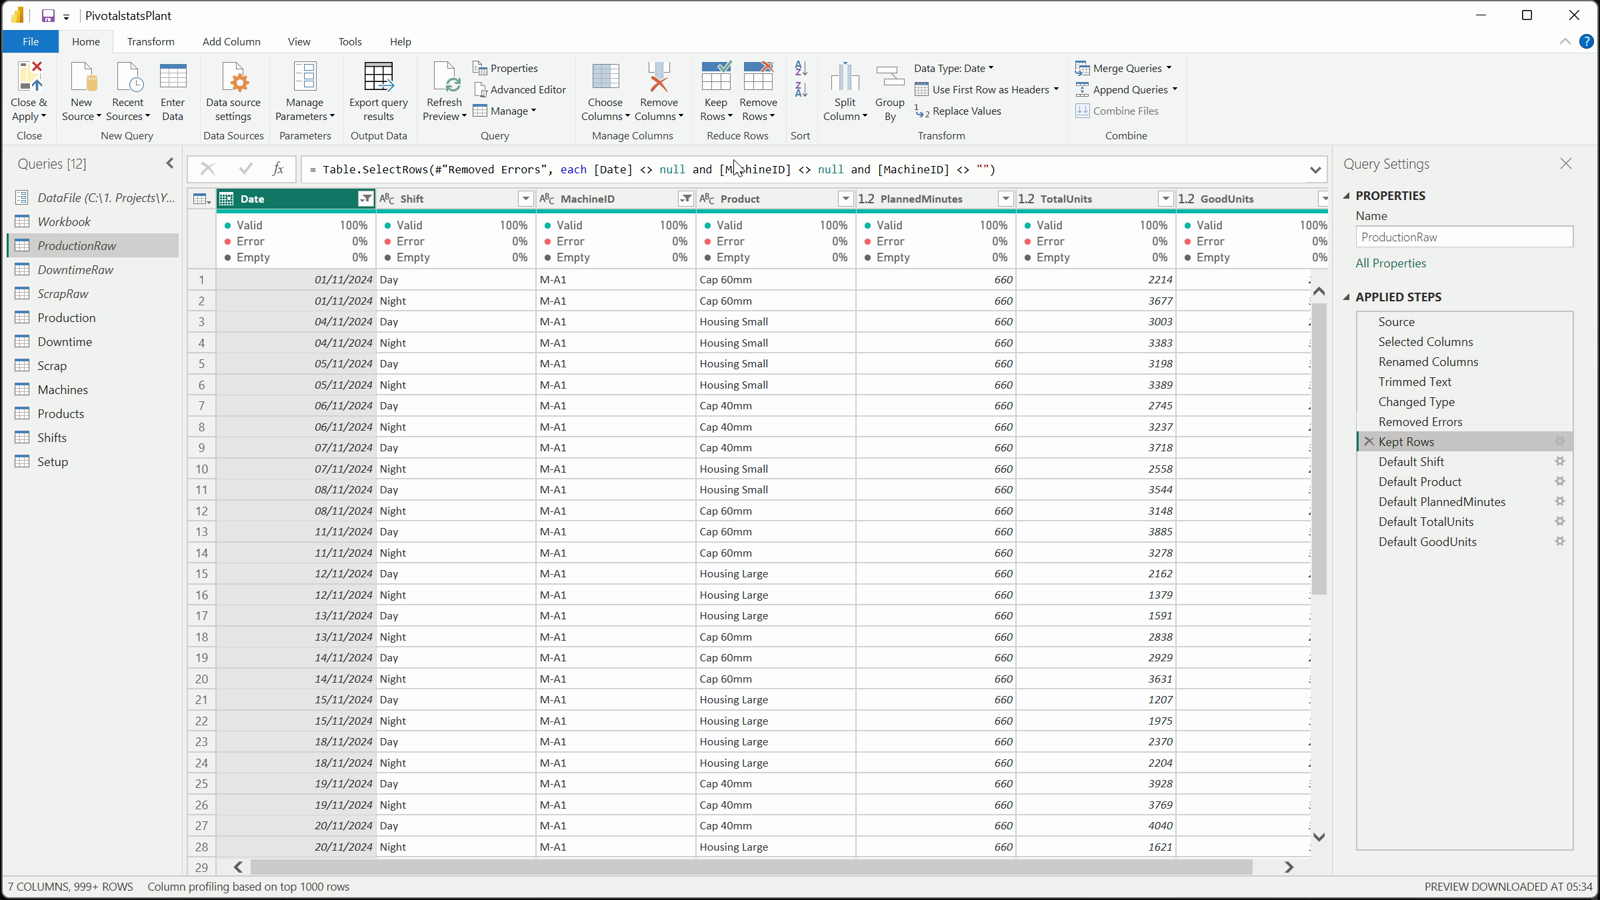
Keep date + machine
M
let

Source = Workbook{[Item = "Production", Kind = "Table"]}[Data],

#"Selected Columns" = Table.SelectColumns(Source, {"Date", "Shift", "Machine ID", "Product", "Planned Minutes", "Total Units", "Good Units"}, MissingField.UseNull),

#"Renamed Columns" = Table.RenameColumns(#"Selected Columns", {{"Machine ID", "MachineID"}, {"Planned Minutes", "PlannedMinutes"}, {"Total Units", "TotalUnits"}, {"Good Units", "GoodUnits"}}),

#"Trimmed Text" = Table.TransformColumns(#"Renamed Columns", {{"Shift", each if _ = null then null else Text.Trim(Text.From(_)), type text}, {"MachineID", each if _ = null then null else Text.Trim(Text.From(_)), type text}, {"Product", each if _ = null then null else Text.Trim(Text.From(_)), type text}}),

#"Changed Type" = Table.TransformColumnTypes(#"Trimmed Text", {{"Date", type date}, {"PlannedMinutes", type number}, {"TotalUnits", type number}, {"GoodUnits", type number}}, "en-US"),

#"Removed Errors" = Table.RemoveRowsWithErrors(#"Changed Type", {"Date", "PlannedMinutes", "TotalUnits", "GoodUnits"}),

#"Kept Rows" = Table.SelectRows(#"Removed Errors", each [Date] <> null and [MachineID] <> null and [MachineID] <> ""),

#"Default Shift" = Table.ReplaceValue(#"Kept Rows", null, "Unassigned", Replacer.ReplaceValue, {"Shift"}),

#"Default Product" = Table.ReplaceValue(#"Default Shift", null, "Unknown product", Replacer.ReplaceValue, {"Product"}),

#"Default PlannedMinutes" = Table.ReplaceValue(#"Default Product", null, 0, Replacer.ReplaceValue, {"PlannedMinutes"}),

#"Default TotalUnits" = Table.ReplaceValue(#"Default PlannedMinutes", null, 0, Replacer.ReplaceValue, {"TotalUnits"}),

#"Default GoodUnits" = Table.ReplaceValue(#"Default TotalUnits", null, 0, Replacer.ReplaceValue, {"GoodUnits"})

in

#"Default GoodUnits"
Step 05: Downtime, scrap and the lists
DowntimeRaw and ScrapRaw follow the same pattern as the shift log; a stop without a category counts as a Breakdown so it still counts against availability. Machines removes duplicate IDs and names unnamed machines after their ID. Shifts combines the shift names from all three logs, so one slicer filters them all.
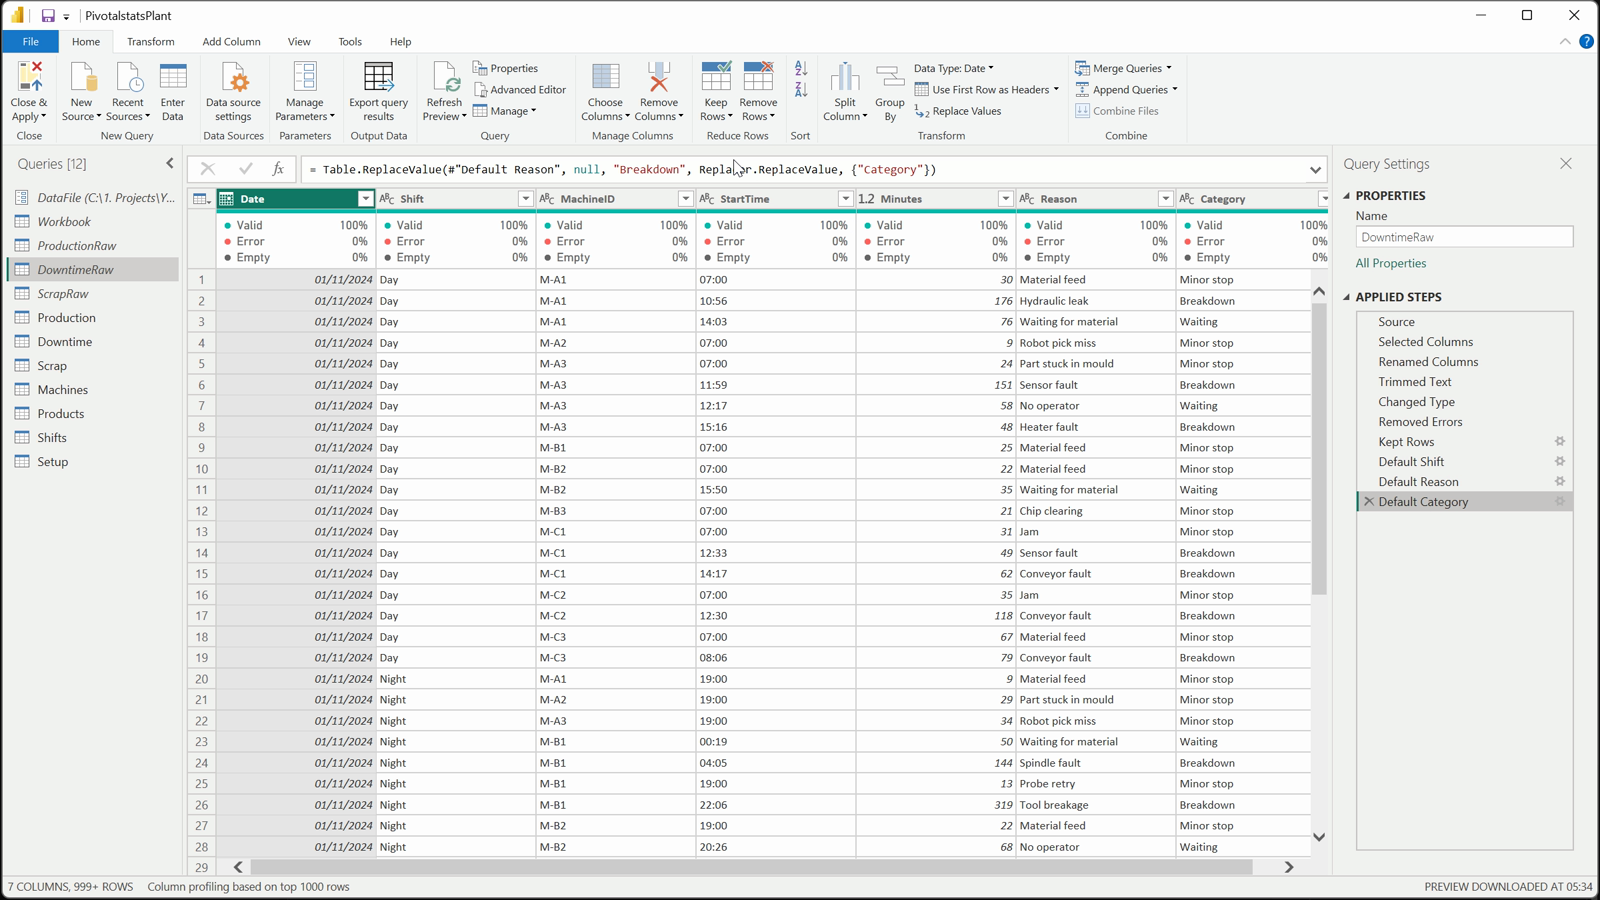
Default Category
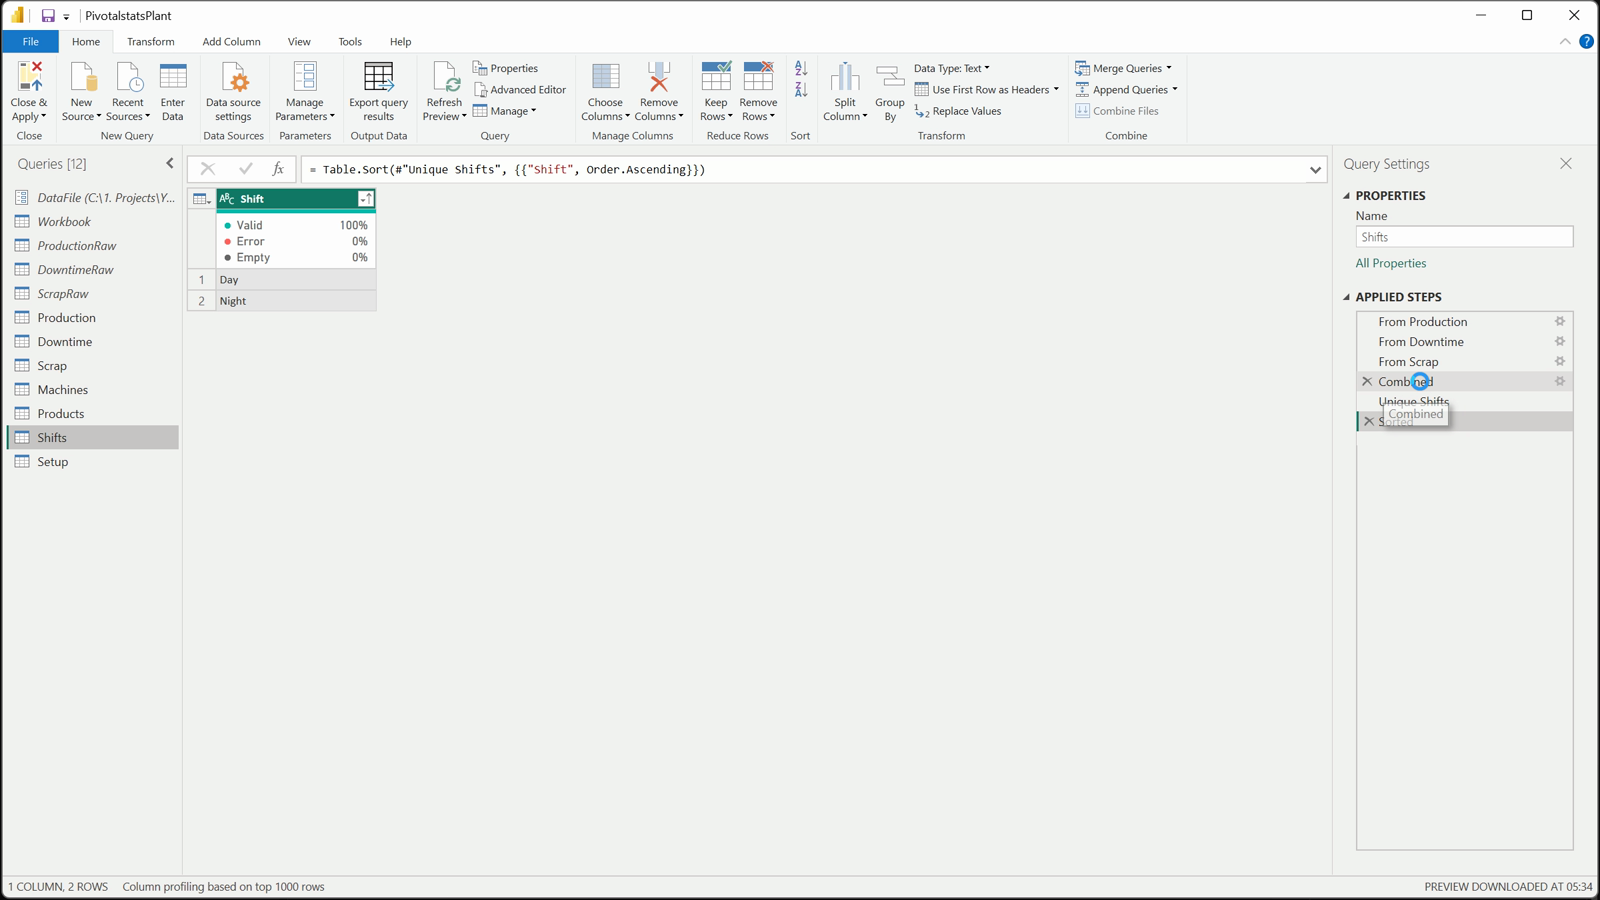
Shifts
M
let

Source = Workbook{[Item = "Downtime", Kind = "Table"]}[Data],

#"Selected Columns" = Table.SelectColumns(Source, {"Date", "Shift", "Machine ID", "Start Time", "Minutes", "Reason", "Category"}, MissingField.UseNull),

#"Renamed Columns" = Table.RenameColumns(#"Selected Columns", {{"Machine ID", "MachineID"}, {"Start Time", "StartTime"}}),

#"Trimmed Text" = Table.TransformColumns(#"Renamed Columns", {{"Shift", each if _ = null then null else Text.Trim(Text.From(_)), type text}, {"MachineID", each if _ = null then null else Text.Trim(Text.From(_)), type text}, {"StartTime", each if _ = null then null else Text.Trim(Text.From(_)), type text}, {"Reason", each if _ = null then null else Text.Trim(Text.From(_)), type text}, {"Category", each if _ = null then null else Text.Trim(Text.From(_)), type text}}),

#"Changed Type" = Table.TransformColumnTypes(#"Trimmed Text", {{"Date", type date}, {"Minutes", type number}}, "en-US"),

#"Removed Errors" = Table.RemoveRowsWithErrors(#"Changed Type", {"Date", "Minutes"}),

#"Kept Rows" = Table.SelectRows(#"Removed Errors", each [Date] <> null and [MachineID] <> null and [MachineID] <> "" and [Minutes] <> null),

#"Default Shift" = Table.ReplaceValue(#"Kept Rows", null, "Unassigned", Replacer.ReplaceValue, {"Shift"}),

#"Default Reason" = Table.ReplaceValue(#"Default Shift", null, "Not given", Replacer.ReplaceValue, {"Reason"}),

#"Default Category" = Table.ReplaceValue(#"Default Reason", null, "Breakdown", Replacer.ReplaceValue, {"Category"})

in

#"Default Category"
Step 06: A star model with three fact tables
The Date table is DAX: it reads the report date from Setup (or uses today), runs from two years before it to the end of the report month, and adds Month Year for chart labels and MonthOffset for the last 12 months. It is marked as a date table.
Production, Downtime and Scrap each relate to Machines, Shifts and Date; Production and Scrap also relate to Products. Sharing the dimensions is what lets one Line or Shift slicer filter availability, performance and quality together.
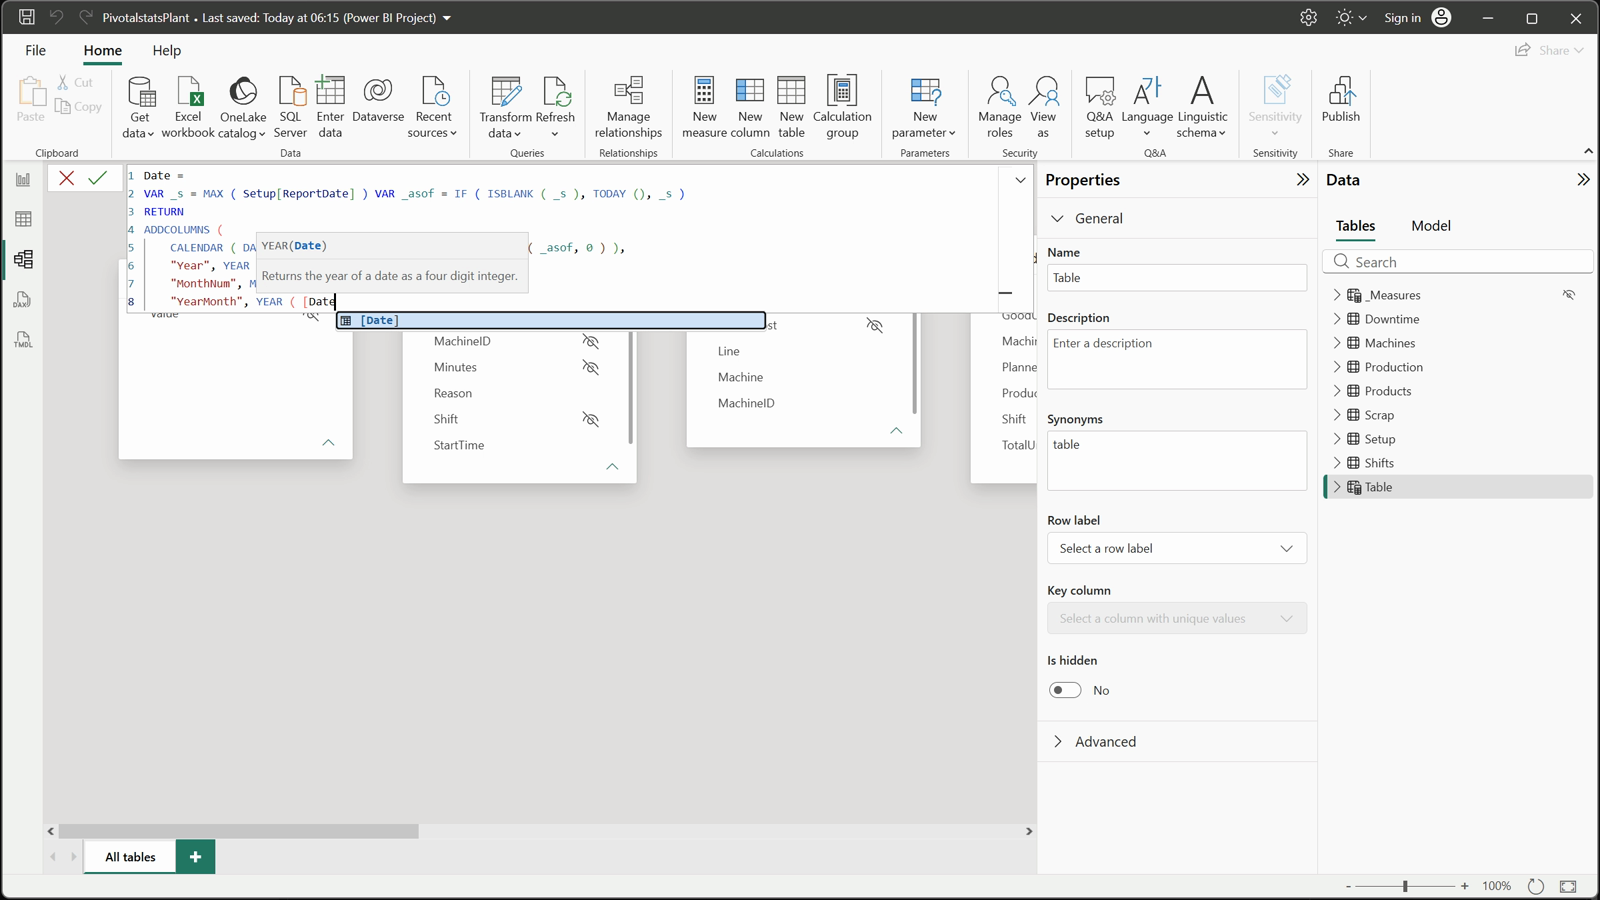
Date table in DAX
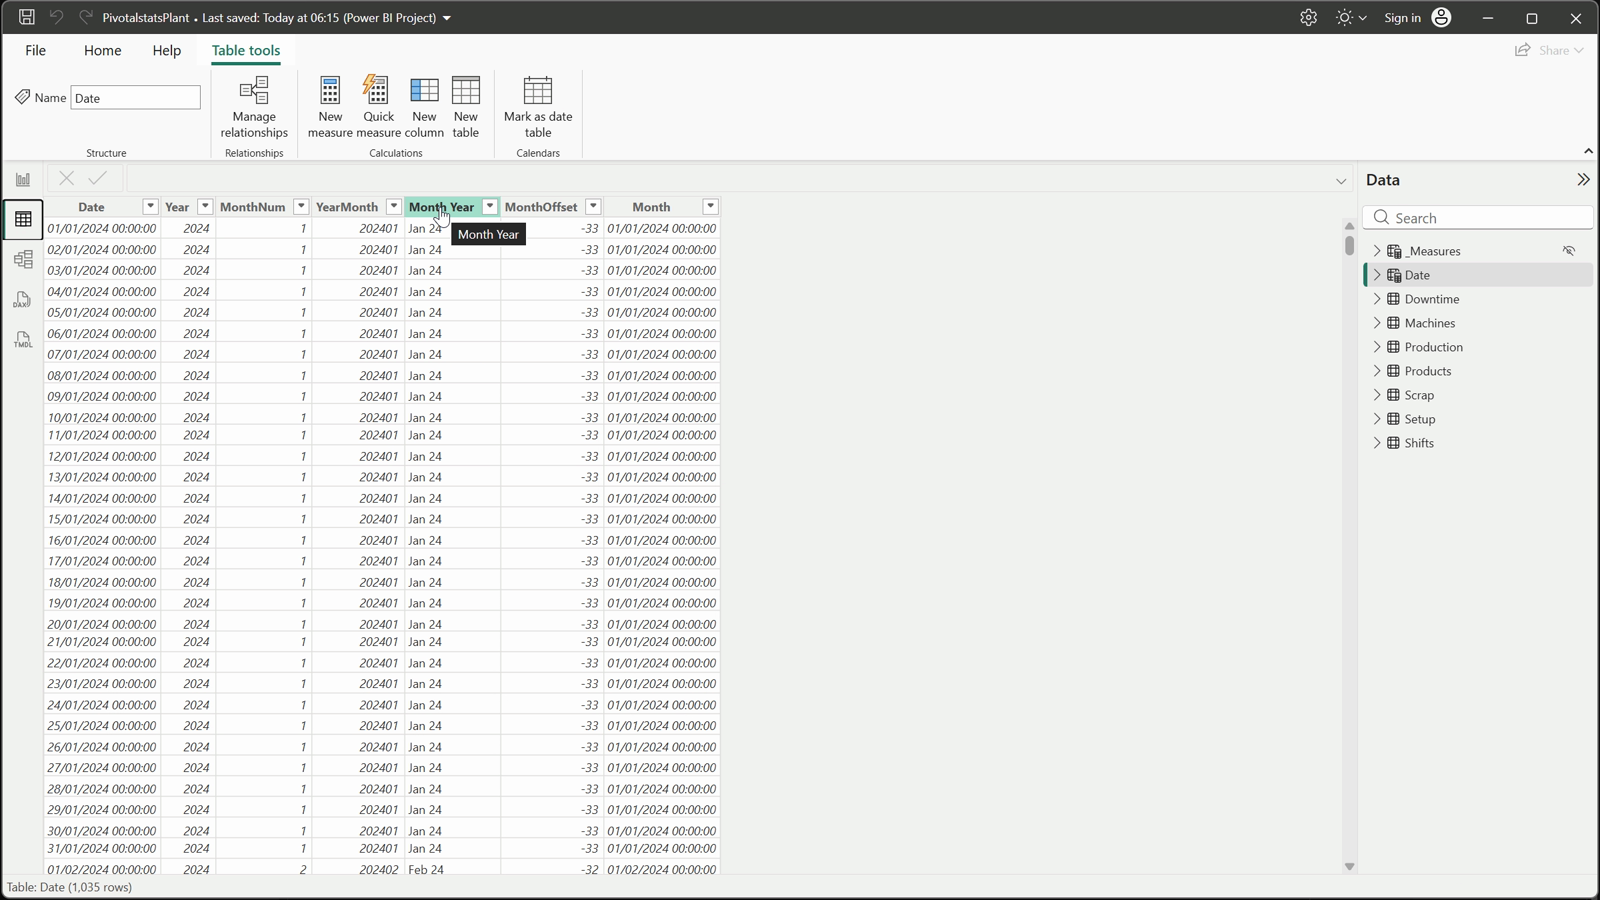
MonthOffset
DAX
Date =

VAR _s = MAX ( Setup[ReportDate] ) VAR _asof = IF ( ISBLANK ( _s ), TODAY (), _s )

RETURN

ADDCOLUMNS (

CALENDAR ( DATE ( YEAR ( _asof ) - 2, 1, 1 ), EOMONTH ( _asof, 0 ) ),

"Year", YEAR ( [Date] ),

"MonthNum", MONTH ( [Date] ),

"YearMonth", YEAR ( [Date] ) * 100 + MONTH ( [Date] ),

"Month Year", FORMAT ( [Date], "mmm", "en-US" ) & UNICHAR ( 10 ) & FORMAT ( [Date], "yy", "en-US" ),

"MonthOffset", ( YEAR ( [Date] ) - YEAR ( _asof ) ) * 12 + MONTH ( [Date] ) - MONTH ( _asof ),

"Month", DATE ( YEAR ( [Date] ), MONTH ( [Date] ), 1 )

)
Step 07: Availability, performance and quality
Planned Production Minutes is the planned time minus Planned stops. Stop Minutes adds up every other stop except minor stops (breakdowns, changeovers, waiting), Run Minutes is what is left, and Availability = Run Minutes / Planned Production Minutes.
Ideal Minutes is how long the units made should have taken at each product’s ideal speed (RELATED fetches it from Products); Performance = Ideal Minutes / Run Minutes, so minor stops and slow running both show up there. Quality = Good Units / Total Units.
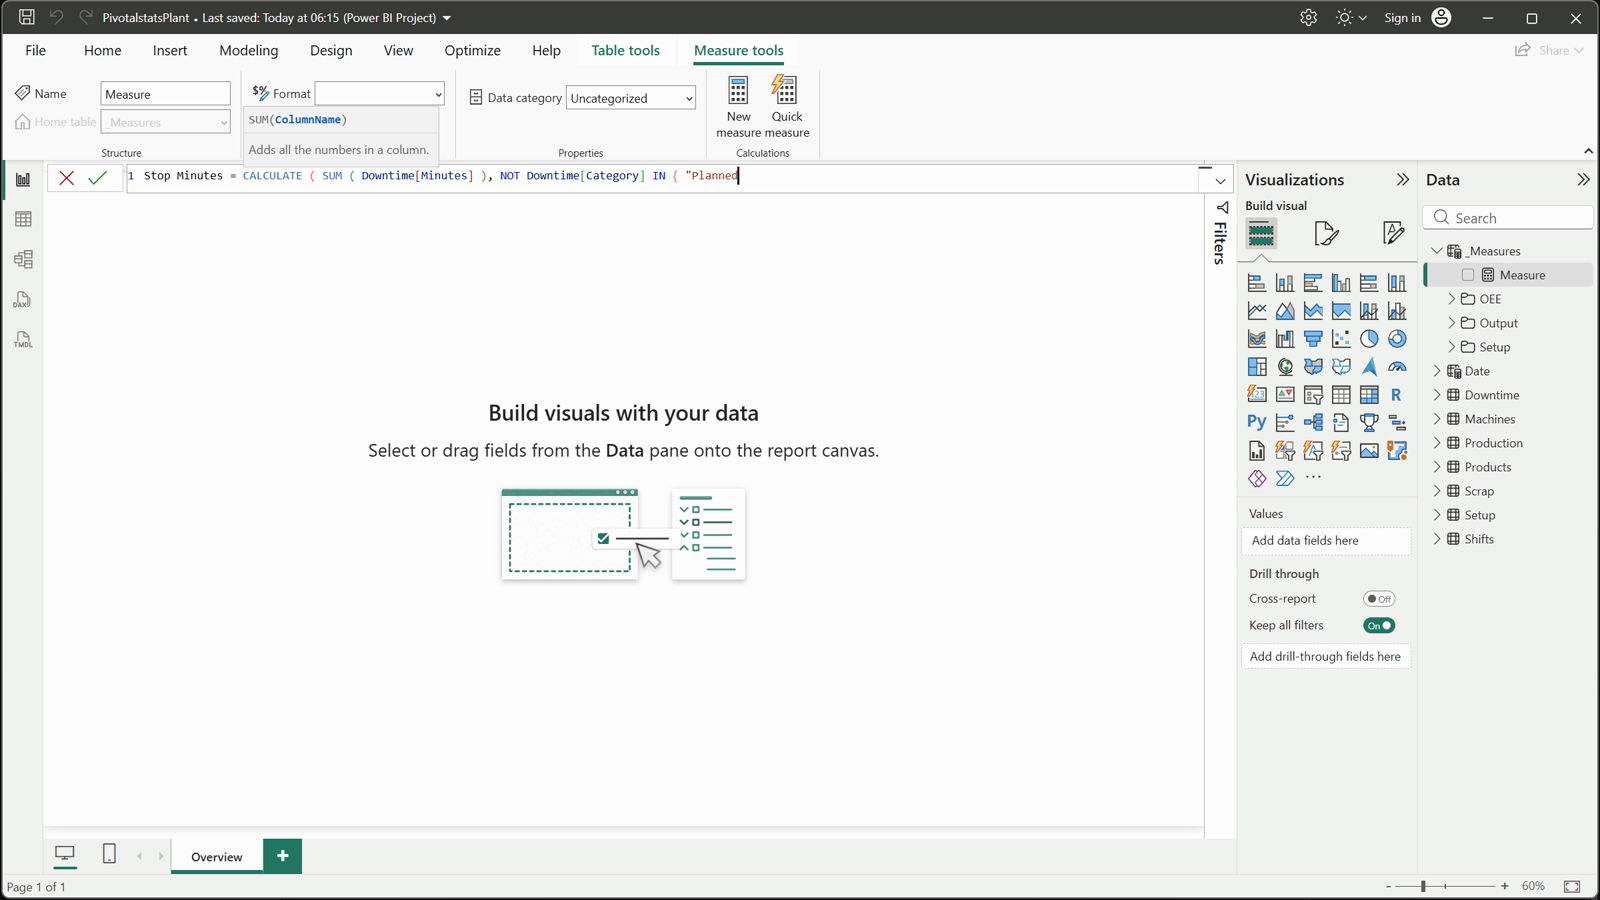
Stop Minutes
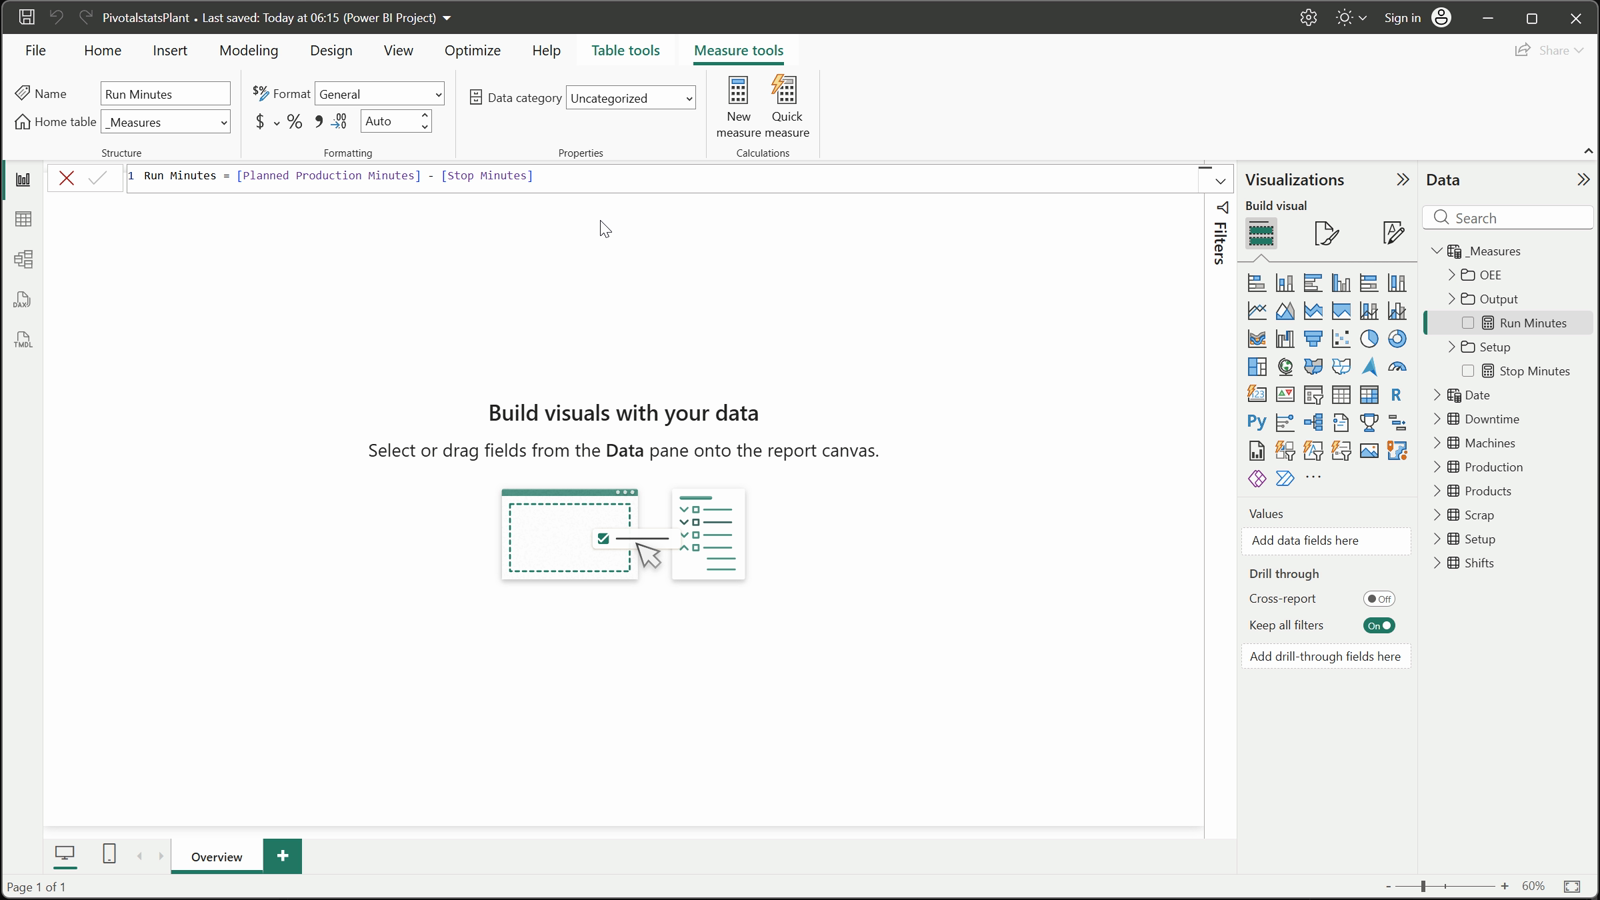
Availability
DAX
Stop Minutes = CALCULATE ( SUM ( Downtime[Minutes] ), NOT Downtime[Category] IN { "Planned", "Minor stop" } ) + 0DAX
Run Minutes = [Planned Production Minutes] - [Stop Minutes]DAX
Ideal Minutes = SUMX ( Production, DIVIDE ( Production[TotalUnits], RELATED ( Products[IdealPerHour] ) ) * 60 )DAX
Availability = DIVIDE ( [Run Minutes], [Planned Production Minutes] )DAX
Performance = DIVIDE ( [Ideal Minutes], [Run Minutes] )DAX
Quality = DIVIDE ( [Good Units], [Total Units] )Step 08: OEE over the last 12 months, and what downtime costs
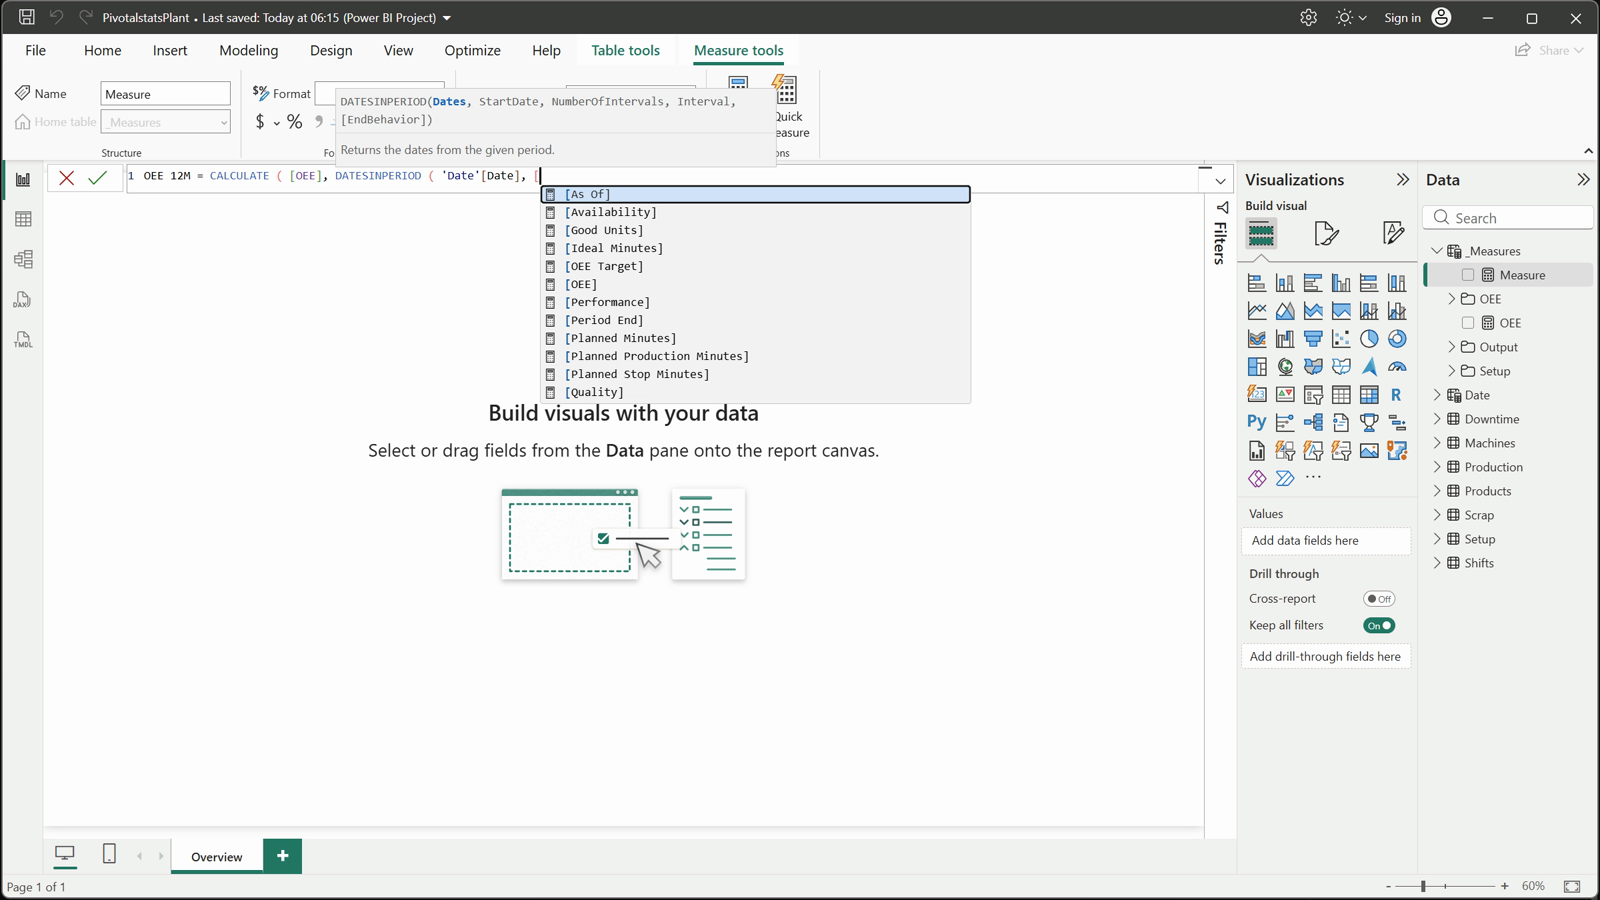
OEE multiplies the three parts only when all three exist, so an empty machine shows blank, not zero. OEE 12M uses DATESINPERIOD for the twelve months up to the report date, and OEE YA moves the same window back a year.
Downtime Cost multiplies each stop’s hours by its machine’s hourly cost. In the sample plant, CNC 2 has the lowest OEE (61.3%) because of its availability (75.6%); every other machine runs more than 85% of its planned time.

OEE = A x P x Q
DATESINPERIOD
DAX
OEE = VAR _a = [Availability] VAR _p = [Performance] VAR _q = [Quality] RETURN IF ( NOT ISBLANK ( _a ) && NOT ISBLANK ( _p ) && NOT ISBLANK ( _q ), _a * _p * _q )DAX
OEE 12M = CALCULATE ( [OEE], DATESINPERIOD ( 'Date'[Date], [Period End], -12, MONTH ) )DAX
OEE YA = CALCULATE ( [OEE], DATESINPERIOD ( 'Date'[Date], EDATE ( [Period End], -12 ), -12, MONTH ) )DAX
Downtime Cost = SUMX ( FILTER ( Downtime, Downtime[Category] <> "Planned" ), Downtime[Minutes] / 60 * RELATED ( Machines[HourlyCost] ) )Step 09: An app-style design you can rebrand
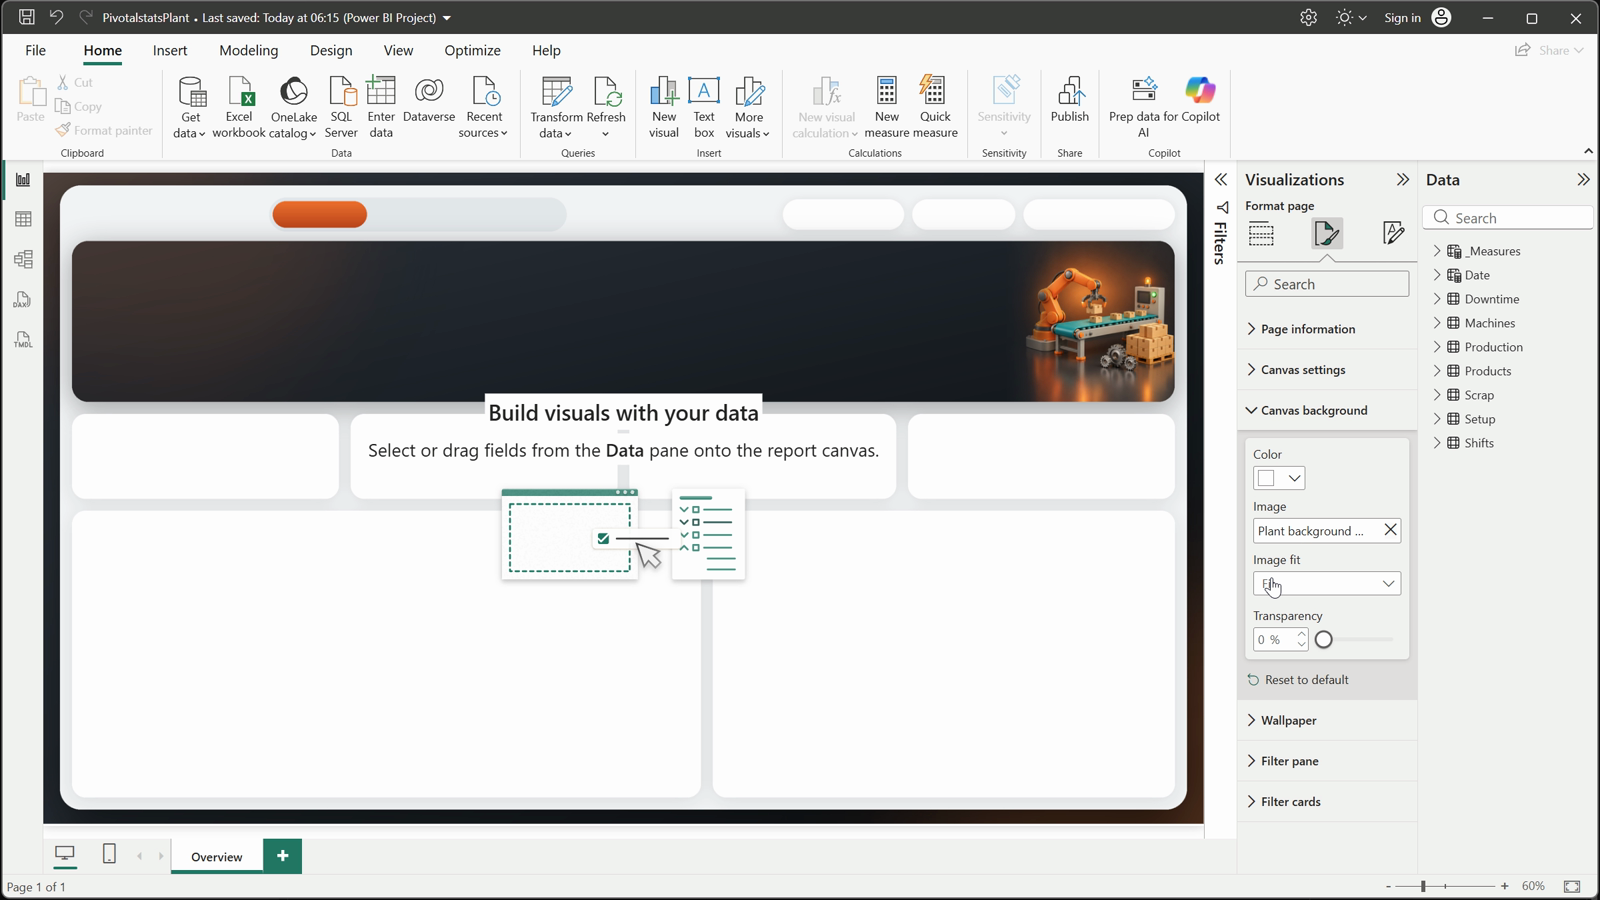
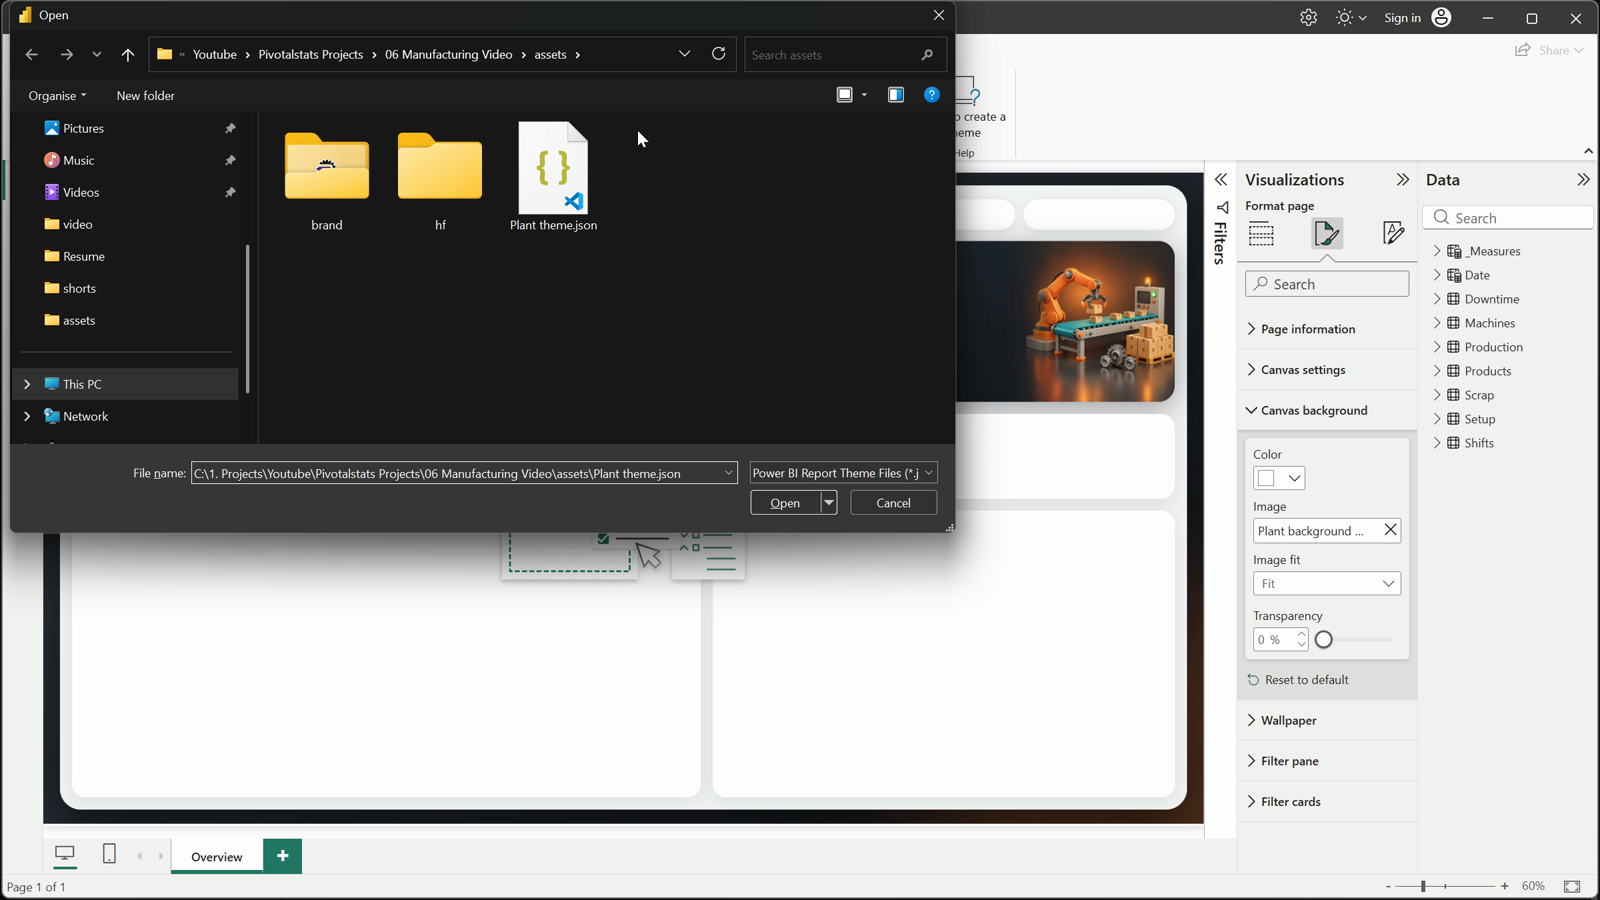
The app window, the dark console, the white cards and the 3D illustration are one 1920 x 1080 background image per page (Canvas background, Fit, 0% transparency), and a theme file sets the fonts and colours and removes visual backgrounds and borders.
The logo is an image visual, the brand name a text box, the tabs are buttons with page navigation, and the Line and Shift slicers are synced across the pages, so everything a buyer might rebrand is a real object.
Canvas background
Theme file
Step 10: The OEE gauge and cards are SVG measures
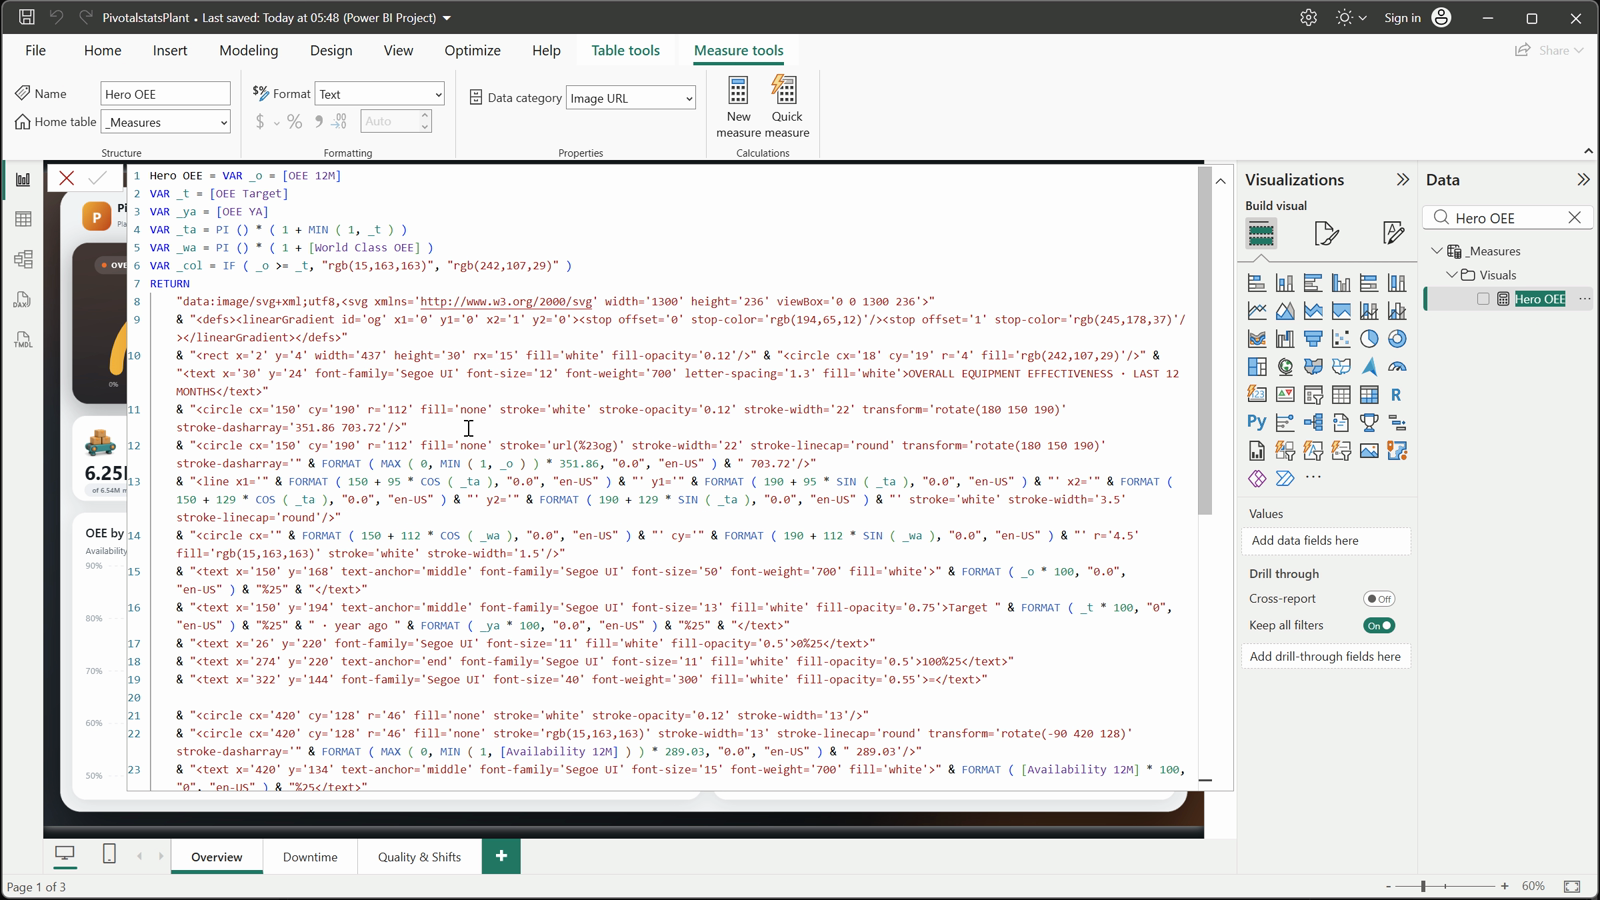
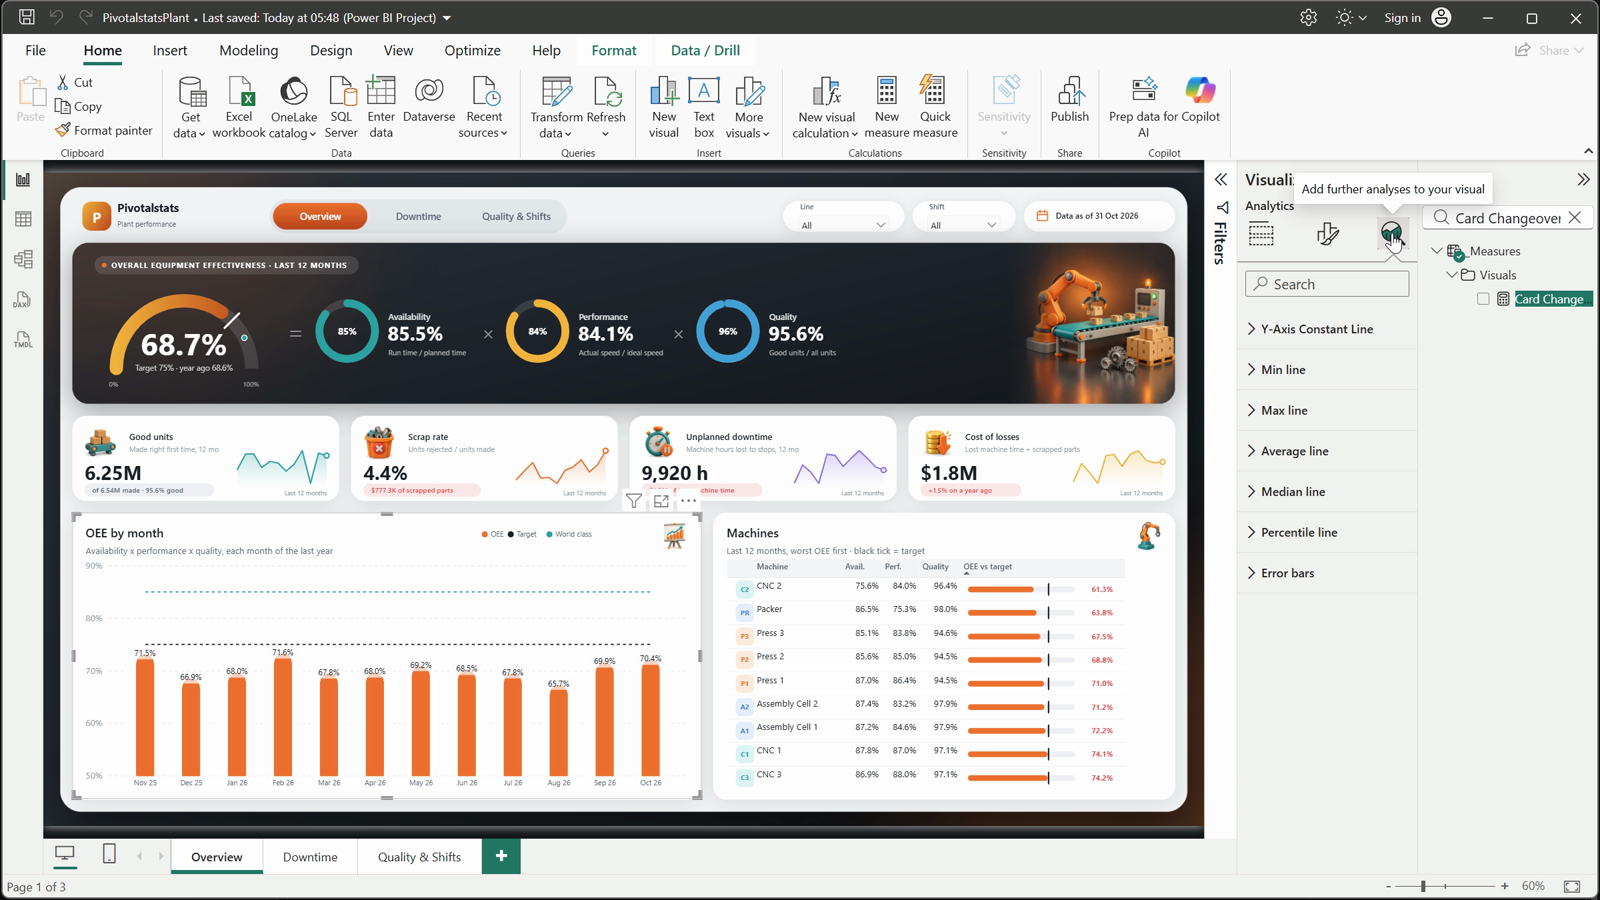
Each console and card is one measure that returns an SVG image (data category Image URL) shown in an image visual. The gauge is a circle whose stroke-dasharray draws half of it, a second circle draws OEE, and COS and SIN place the target tick on the arc; the three rings use the same dash trick.
The cards loop over the last twelve months with GENERATESERIES and CALCULATE, join the points with CONCATENATEX into a line and shaded area, and draw the target as a dashed line. The 3D icons are separate image visuals.

One measure, one picture
stroke-dasharray
DAX
Card Changeover =

VAR _pill = "Target " & FORMAT ( [Changeover Target], "0", "en-US" ) & " min · " & FORMAT ( [Changeovers 12M], "#,0", "en-US" ) & " changeovers"

VAR _tone = IF ( [Avg Changeover 12M] > [Changeover Target], -1, 1 )

VAR _fg = SWITCH ( _tone, 1, "rgb(18,161,80)", -1, "rgb(229,72,77)", 2, "rgb(183,121,31)", "rgb(95,104,117)" )

VAR _bg = SWITCH ( _tone, 1, "rgb(227,247,236)", -1, "rgb(253,232,232)", 2, "rgb(254,243,217)", "rgb(238,240,243)" )

VAR _pw = 26 + LEN ( _pill ) * 6.7

VAR _e = [Period End]

VAR _s = ADDCOLUMNS ( GENERATESERIES ( 0, 11 ), "@ym", VAR _m = EOMONTH ( _e, - [Value] ) RETURN YEAR ( _m ) * 100 + MONTH ( _m ) )

VAR _sv = ADDCOLUMNS ( _s, "@v", VAR _ym = [@ym] RETURN CALCULATE ( [Avg Changeover], 'Date'[YearMonth] = _ym ) )

VAR _t0 = [Changeover Target]

VAR _mx0 = MAXX ( _sv, [@v] )

VAR _mn0 = MINX ( _sv, [@v] )

VAR _mx = IF ( NOT ISBLANK ( _t0 ), MAX ( _mx0, _t0 ), _mx0 )

VAR _mn = IF ( NOT ISBLANK ( _t0 ), MIN ( _mn0, _t0 ), _mn0 )

VAR _pts = CONCATENATEX ( _sv,

VAR _x = 273 + ( 11 - [Value] ) * 13.4

VAR _y = IF ( _mx > _mn, 112 - ( [@v] - _mn ) / ( _mx - _mn ) * 54, 85 )

RETURN FORMAT ( _x, "0.0", "en-US" ) & "," & FORMAT ( _y, "0.0", "en-US" ), " ", [Value], DESC )

VAR _last = MAXX ( FILTER ( _sv, [Value] = 0 ), [@v] )

VAR _ly = IF ( _mx > _mn, 112 - ( _last - _mn ) / ( _mx - _mn ) * 54, 85 )

VAR _tv = [Changeover Target]

VAR _ty = IF ( _mx > _mn, 112 - ( _tv - _mn ) / ( _mx - _mn ) * 54, 85 )

VAR _tline = IF ( _tv >= _mn && _tv <= _mx, "<line x1='273' y1='" & FORMAT ( _ty, "0.0", "en-US" ) & "' x2='421' y2='" & FORMAT ( _ty, "0.0", "en-US" ) & "' stroke='rgb(27,32,39)' stroke-width='1.3' stroke-dasharray='4 3' stroke-opacity='0.55'/>", "" )

RETURN

"data:image/svg+xml;utf8,<svg xmlns='http://www.w3.org/2000/svg' width='441' height='140' viewBox='0 0 441 140'>"

& "<defs><linearGradient id='g' x1='0' y1='0' x2='0' y2='1'><stop offset='0' stop-color='rgb(245,178,37)' stop-opacity='0.28'/><stop offset='1' stop-color='rgb(245,178,37)' stop-opacity='0'/></linearGradient></defs>"

& "<text x='94' y='40' font-family='Segoe UI' font-size='14.5' font-weight='600' fill='rgb(27,32,39)'>Average changeover</text>"

& "<text x='94' y='60' font-family='Segoe UI' font-size='12' fill='rgb(154,162,173)'>Minutes per product change</text>"

& "<text x='20' y='106' font-family='Segoe UI' font-size='32' font-weight='700' fill='rgb(27,32,39)'>" & FORMAT ( [Avg Changeover 12M], "0", "en-US" ) & " min" & "</text>"

& "<rect x='20' y='112' width='" & FORMAT ( _pw, "0", "en-US" ) & "' height='22' rx='11' fill='" & _bg & "'/>"

& "<text x='33' y='127.5' font-family='Segoe UI' font-size='11.5' font-weight='600' fill='" & _fg & "'>" & _pill & "</text>"

& "<polygon points='273,116 " & _pts & " 420.4,116' fill='url(%23g)'/>"

& "<polyline points='" & _pts & "' fill='none' stroke='rgb(245,178,37)' stroke-width='2.2' stroke-linejoin='round' stroke-linecap='round'/>"

& _tline

& "<circle cx='420.4' cy='" & FORMAT ( _ly, "0.0", "en-US" ) & "' r='4' fill='white' stroke='rgb(245,178,37)' stroke-width='2.4'/>"

& "<text x='421' y='132' text-anchor='end' font-family='Segoe UI' font-size='10.5' fill='rgb(154,162,173)'>Last 12 months</text>"

& "</svg>"
Step 11: OEE by month and by machine
The monthly chart is a standard combo chart: rounded OEE columns (white columns with error bars on top) and the target and world-class lines on the same axis. In the sample plant no month reached the 75% target; August was the weakest at 65.7%.
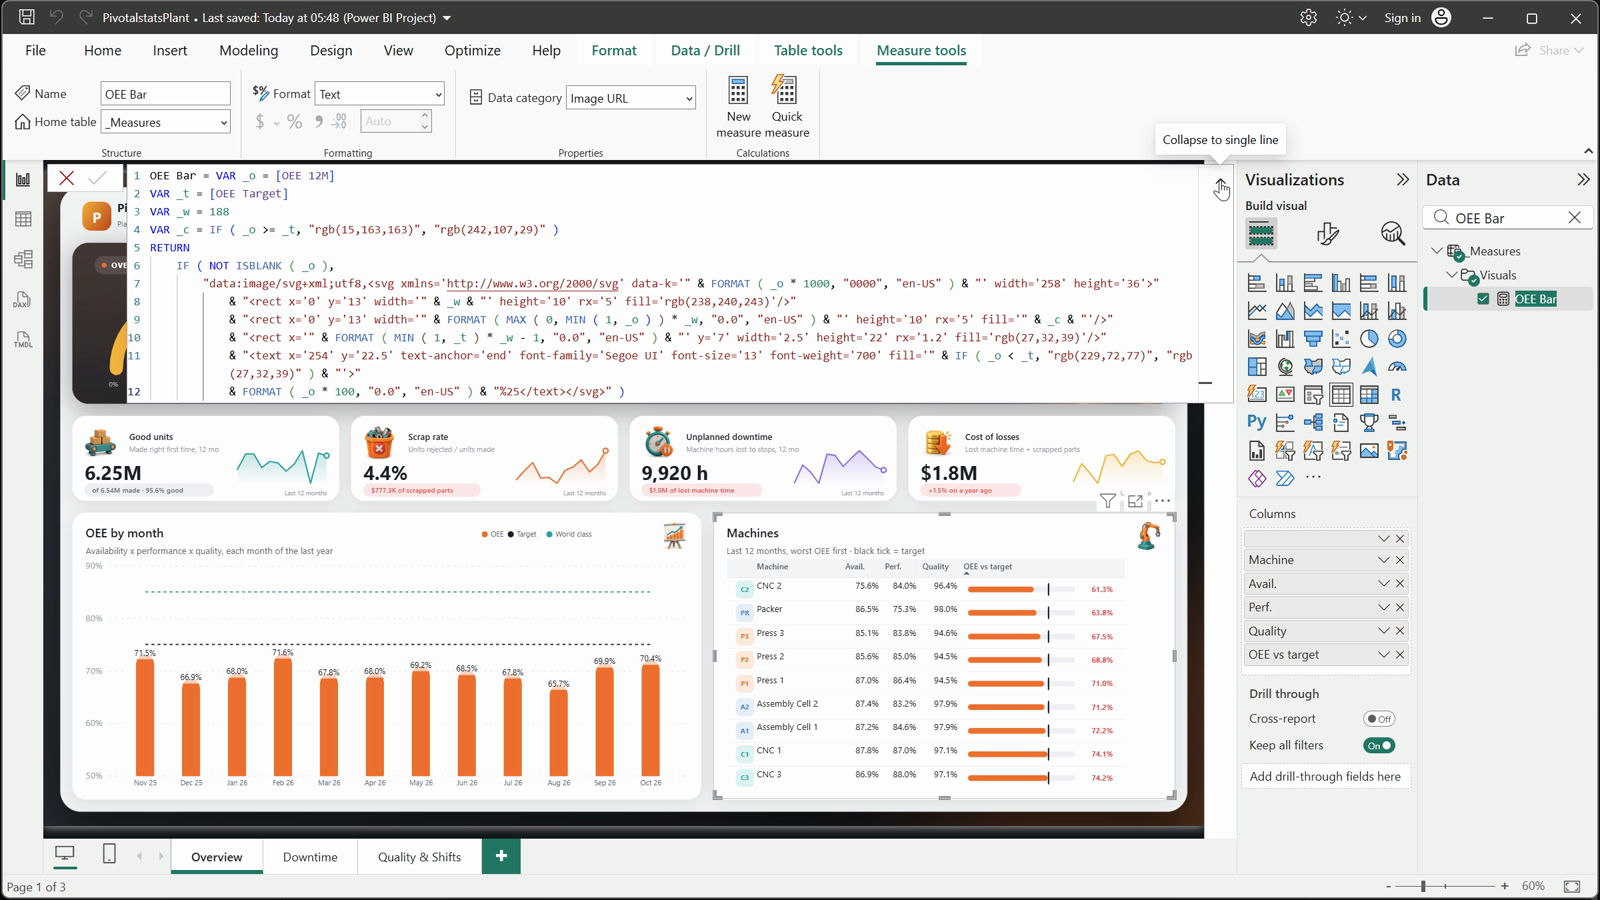
The machines table uses SVG measures for the chip and the OEE bar; a hidden data-k sort key in the bar sorts the table worst first. CNC 2 loses availability to breakdowns, while the Packer loses speed to jams.
Hidden sort key
Rounded columns
DAX
Mo OEE = IF ( HASONEVALUE ( 'Date'[YearMonth] ) && NOT ISBLANK ( MAX ( 'Date'[Date] ) ) && MAX ( 'Date'[MonthOffset] ) >= -11 && MAX ( 'Date'[MonthOffset] ) <= 0, [OEE] )DAX
OEE Bar =

VAR _o = [OEE 12M]

VAR _t = [OEE Target]

VAR _w = 188

VAR _c = IF ( _o >= _t, "rgb(15,163,163)", "rgb(242,107,29)" )

RETURN

IF ( NOT ISBLANK ( _o ),

"data:image/svg+xml;utf8,<svg xmlns='http://www.w3.org/2000/svg' data-k='" & FORMAT ( _o * 1000, "0000", "en-US" ) & "' width='258' height='36'>"

& "<rect x='0' y='13' width='" & _w & "' height='10' rx='5' fill='rgb(238,240,243)'/>"

& "<rect x='0' y='13' width='" & FORMAT ( MAX ( 0, MIN ( 1, _o ) ) * _w, "0.0", "en-US" ) & "' height='10' rx='5' fill='" & _c & "'/>"

& "<rect x='" & FORMAT ( MIN ( 1, _t ) * _w - 1, "0.0", "en-US" ) & "' y='7' width='2.5' height='22' rx='1.2' fill='rgb(27,32,39)'/>"

& "<text x='254' y='22.5' text-anchor='end' font-family='Segoe UI' font-size='13' font-weight='700' fill='" & IF ( _o < _t, "rgb(229,72,77)", "rgb(27,32,39)" ) & "'>"

& FORMAT ( _o * 100, "0.0", "en-US" ) & "%25</text></svg>" )
Step 12: Where the hours went
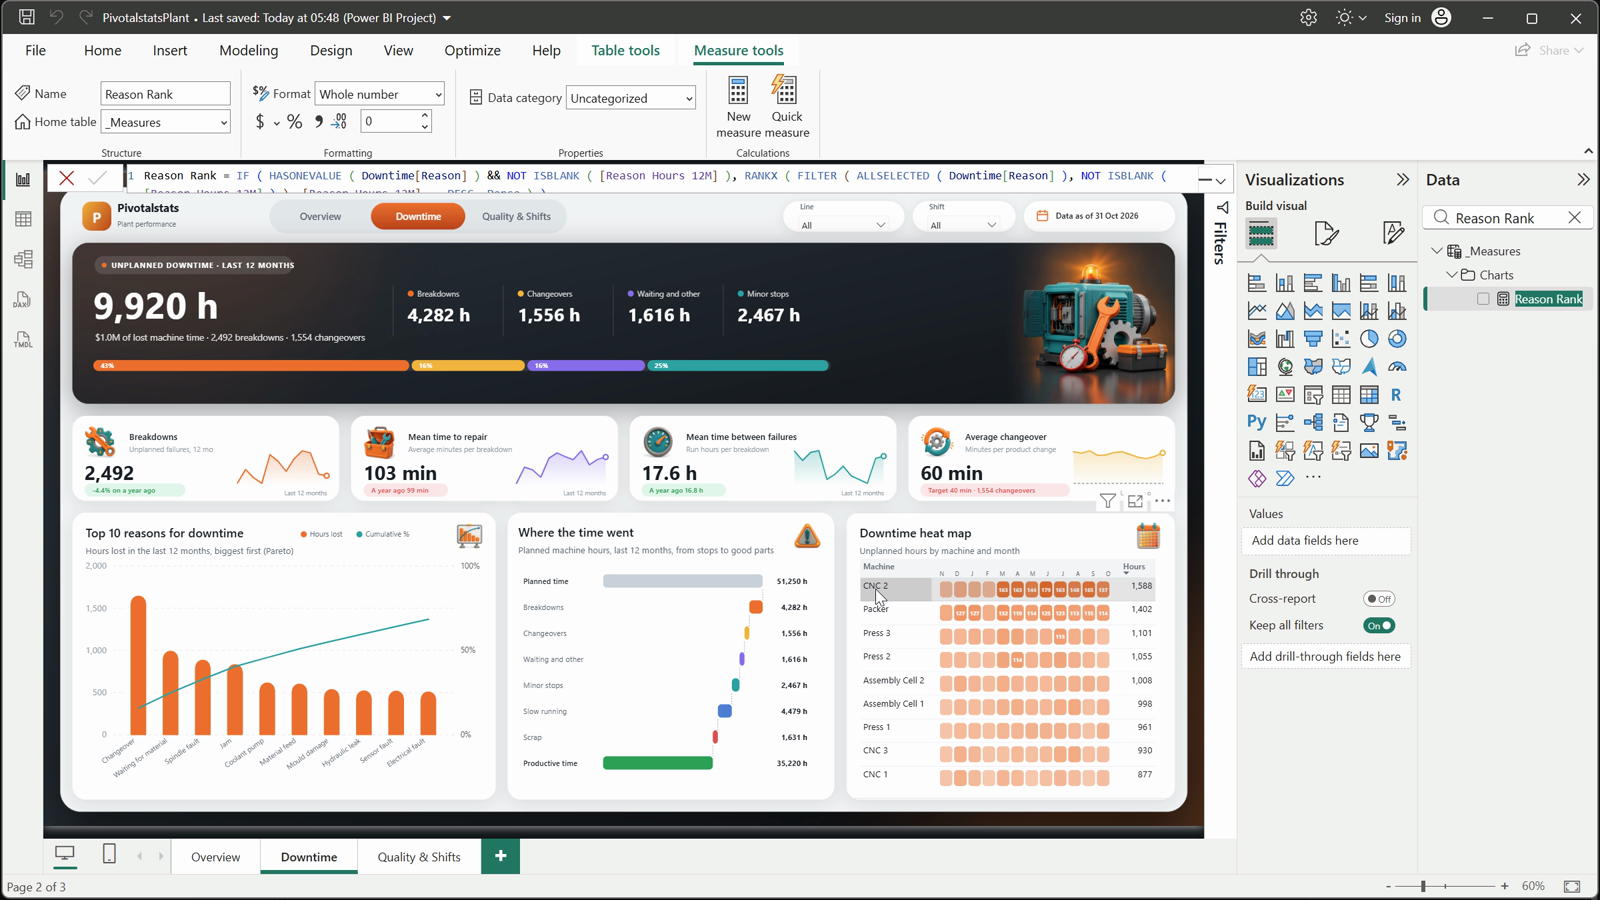
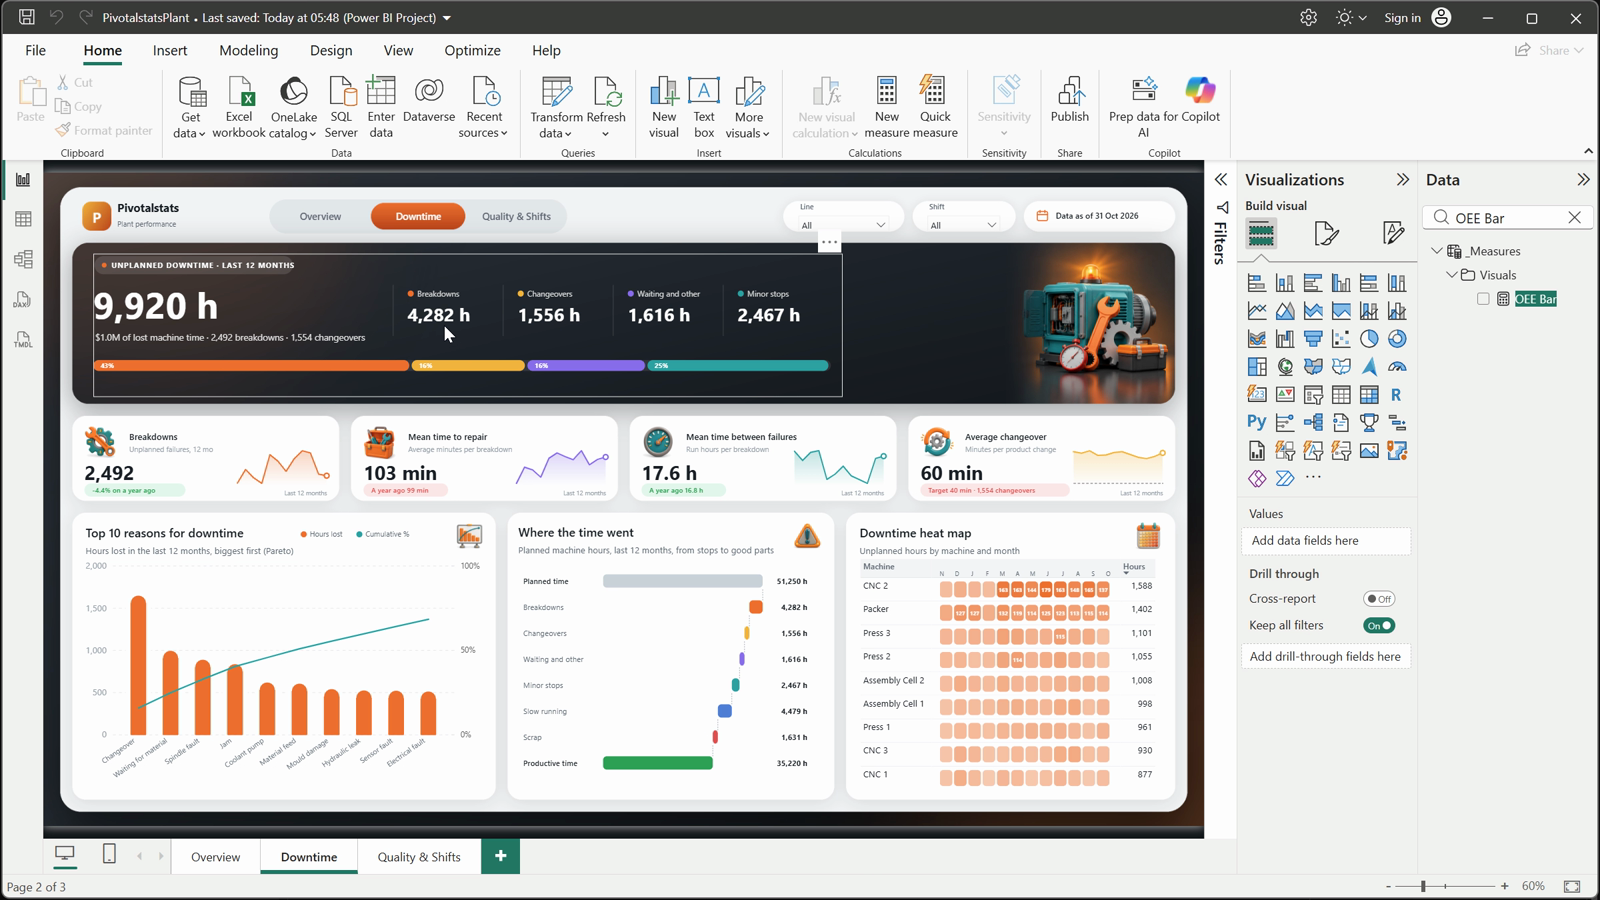
The Pareto chart ranks downtime reasons with RANKX, keeps the top ten and adds a cumulative line. The waterfall is one SVG measure in machine hours, from planned production time through breakdowns, changeovers, waiting, minor stops, slow running and scrap to productive time; productive time / planned time is the OEE.
The heat map is a table with one SVG row per machine: GENERATESERIES steps through the last twelve months and each cell’s opacity follows its downtime hours.
CNC 2 from March
Breakdowns: 43%
DAX
Pareto Cumulative =

VAR _cur = [Reason Hours 12M]

VAR _all = FILTER ( ALLSELECTED ( Downtime[Reason] ), NOT ISBLANK ( [Reason Hours 12M] ) )

VAR _r = [Reason Rank]

RETURN

IF ( NOT ISBLANK ( _r ) && _r <= 10,

DIVIDE ( SUMX ( FILTER ( _all, [Reason Hours 12M] >= _cur ), [Reason Hours 12M] ), SUMX ( _all, [Reason Hours 12M] ) ) )
DAX
Heat Row =

VAR _e = [Period End]

VAR _months = ADDCOLUMNS ( GENERATESERIES ( 0, 11 ), "@ym", VAR _m = EOMONTH ( _e, - [Value] ) RETURN YEAR ( _m ) * 100 + MONTH ( _m ) )

VAR _row = ADDCOLUMNS ( _months, "@v", VAR _ym = [@ym] RETURN CALCULATE ( [Heat Hours], 'Date'[YearMonth] = _ym ) )

VAR _max = MAXX ( ALLSELECTED ( Machines[Machine] ), MAXX ( _months, VAR _ym = [@ym] RETURN CALCULATE ( [Heat Hours], 'Date'[YearMonth] = _ym ) ) )

VAR _cells = CONCATENATEX ( _row,

VAR _t = DIVIDE ( [@v], _max )

RETURN "<rect x='" & ( ( 11 - [Value] ) * 25 ) & "' y='4' width='22' height='28' rx='6' fill='rgb(242,107,29)' fill-opacity='" & FORMAT ( 0.07 + 0.93 * _t, "0.00", "en-US" ) & "'/>"

& IF ( _t > 0.62, "<text x='" & ( ( 11 - [Value] ) * 25 + 11 ) & "' y='22' text-anchor='middle' font-family='Segoe UI' font-size='9.5' font-weight='700' fill='white'>" & FORMAT ( [@v], "0", "en-US" ) & "</text>", "" ),

"", [Value], DESC )

RETURN

IF ( HASONEVALUE ( Machines[Machine] ) && [Planned Minutes 12M] > 0,

"data:image/svg+xml;utf8,<svg xmlns='http://www.w3.org/2000/svg' data-k='" & FORMAT ( [Downtime Hours 12M], "00000", "en-US" ) & "' width='300' height='36'>" & _cells & "</svg>" )
Step 13: Scrap, shifts and products
Why parts are scrapped is a stacked bar of production and startup rejects by reason. The shift chart and the day-and-night table (an SVG dumbbell per line) show where the gap between shifts comes from: in the sample plant, only the Moulding presses scrap more at night.
Scrap by product ranks every product by scrap rate with its scrap cost (rejected units x unit cost).
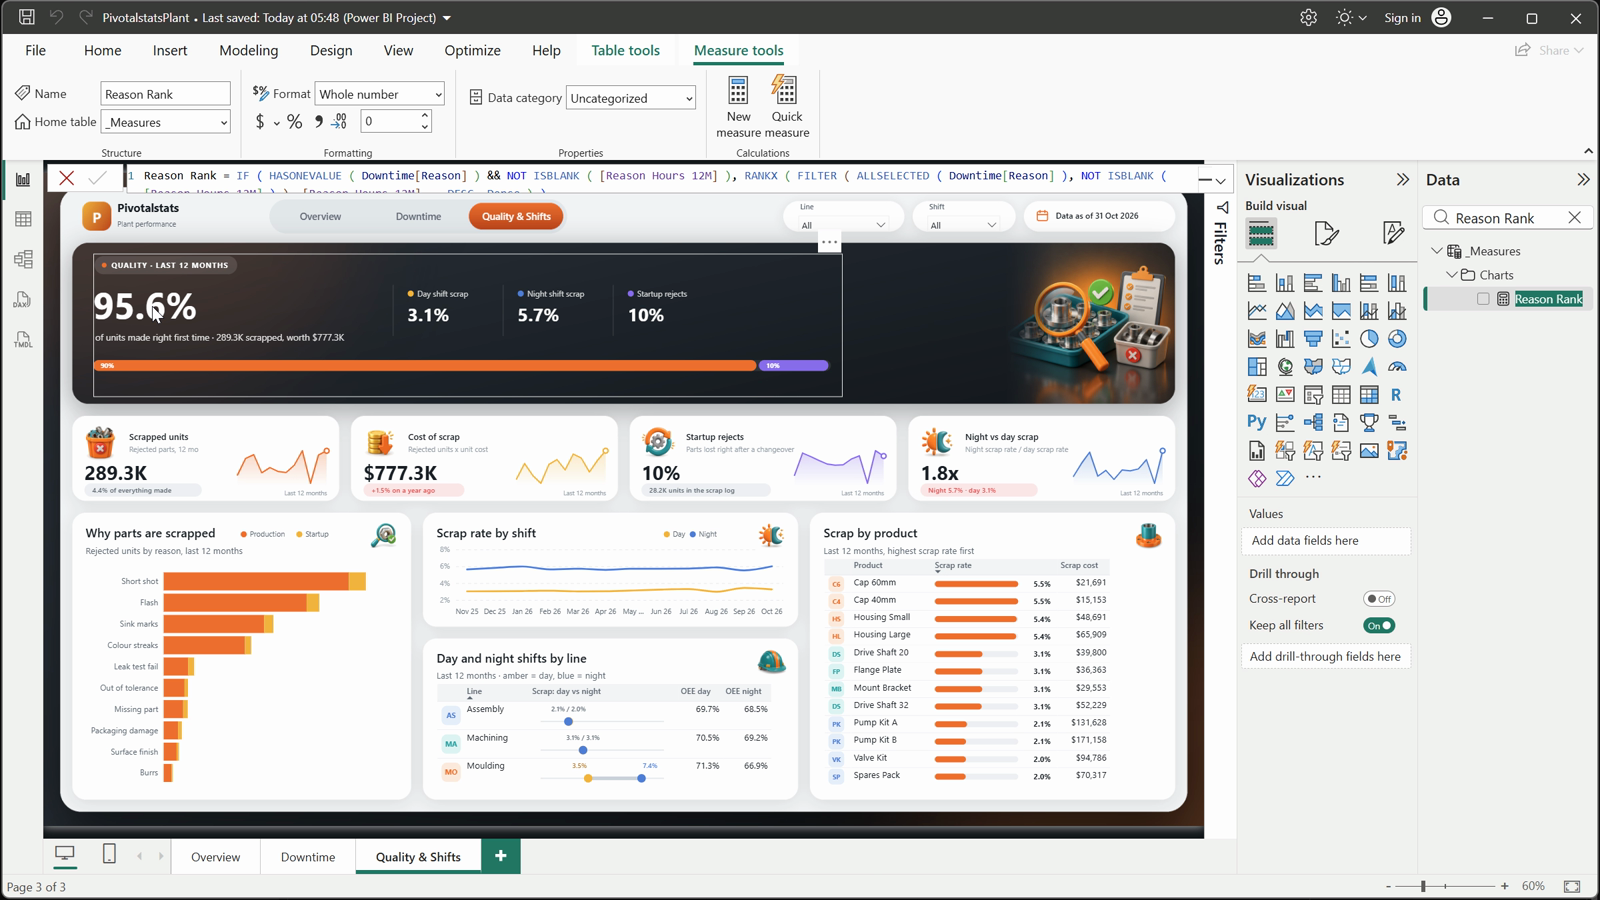
95.6% right first time
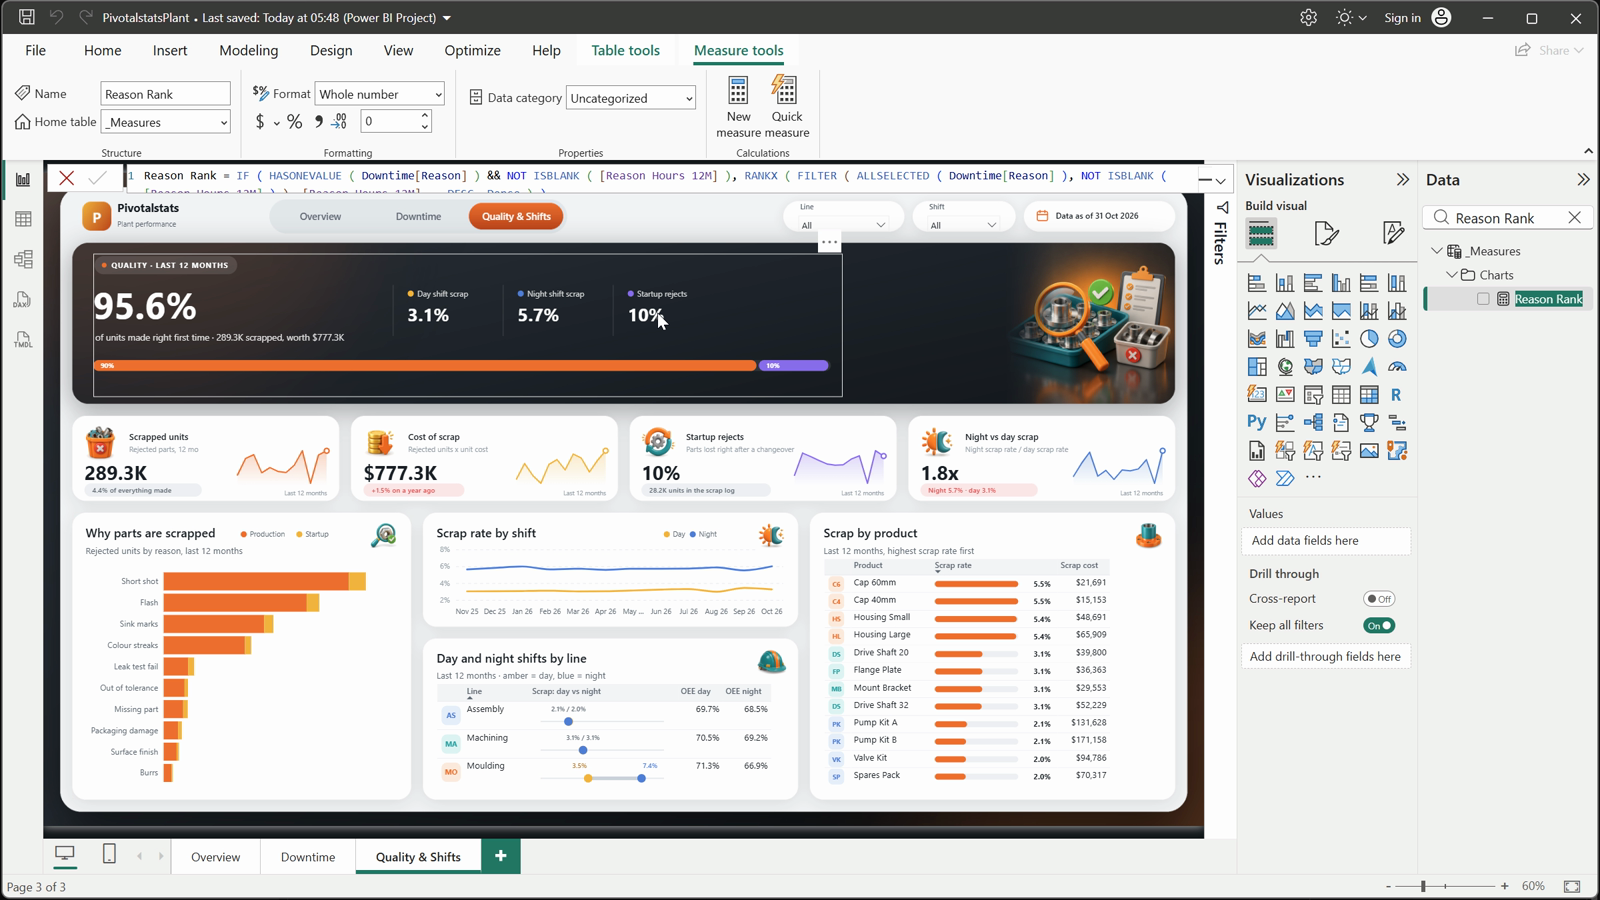
Production vs startup
DAX
Shift Dumbbell =

VAR _d = [Scrap Rate Day 12M]

VAR _n = [Scrap Rate Night 12M]

VAR _top = MAXX ( ALLSELECTED ( Machines[Line] ), MAX ( [Scrap Rate Day 12M], [Scrap Rate Night 12M] ) ) * 1.15

VAR _sx = 192

VAR _xd = 14 + DIVIDE ( _d, _top ) * _sx

VAR _xn = 14 + DIVIDE ( _n, _top ) * _sx

RETURN

IF ( NOT ISBLANK ( _d ) || NOT ISBLANK ( _n ),

"data:image/svg+xml;utf8,<svg xmlns='http://www.w3.org/2000/svg' width='232' height='44'>"

& "<line x1='14' y1='32' x2='218' y2='32' stroke='rgb(229,232,236)' stroke-width='2'/>"

& "<line x1='" & FORMAT ( _xd, "0.0", "en-US" ) & "' y1='32' x2='" & FORMAT ( _xn, "0.0", "en-US" ) & "' y2='32' stroke='rgb(203,210,218)' stroke-width='6' stroke-linecap='round'/>"

& "<circle cx='" & FORMAT ( _xd, "0.0", "en-US" ) & "' cy='32' r='7' fill='rgb(245,178,37)'/>"

& "<circle cx='" & FORMAT ( _xn, "0.0", "en-US" ) & "' cy='32' r='7' fill='rgb(76,127,217)'/>"

& IF ( ABS ( _xd - _xn ) < 46,

"<text x='" & FORMAT ( ( _xd + _xn ) / 2, "0.0", "en-US" ) & "' y='15' text-anchor='middle' font-family='Segoe UI' font-size='11' font-weight='600' fill='rgb(95,104,117)'>" & FORMAT ( _d * 100, "0.0", "en-US" ) & "%25" & " / " & FORMAT ( _n * 100, "0.0", "en-US" ) & "%25" & "</text>",

"<text x='" & FORMAT ( MIN ( _xd, _xn ) - 2, "0.0", "en-US" ) & "' y='15' text-anchor='end' font-family='Segoe UI' font-size='11' font-weight='600' fill='"

& IF ( _d <= _n, "rgb(183,121,31)'>" & FORMAT ( _d * 100, "0.0", "en-US" ) & "%25", "rgb(76,127,217)'>" & FORMAT ( _n * 100, "0.0", "en-US" ) & "%25" ) & "</text>"

& "<text x='" & FORMAT ( MIN ( MAX ( _xd, _xn ) + 2, 188 ), "0.0", "en-US" ) & "' y='15' font-family='Segoe UI' font-size='11' font-weight='600' fill='"

& IF ( _d <= _n, "rgb(76,127,217)'>" & FORMAT ( _n * 100, "0.0", "en-US" ) & "%25", "rgb(183,121,31)'>" & FORMAT ( _d * 100, "0.0", "en-US" ) & "%25" ) & "</text>" ) & "</svg>" )
Step 14: Update it and find the cause
To update the report, paste new rows under the tables in the workbook, save it and click Refresh. The Line and Shift slicers then narrow every page: in the sample plant, Machining shows CNC 2 well below CNC 1 and CNC 3, and Moulding on the night shift scraps 7.4% of its parts.
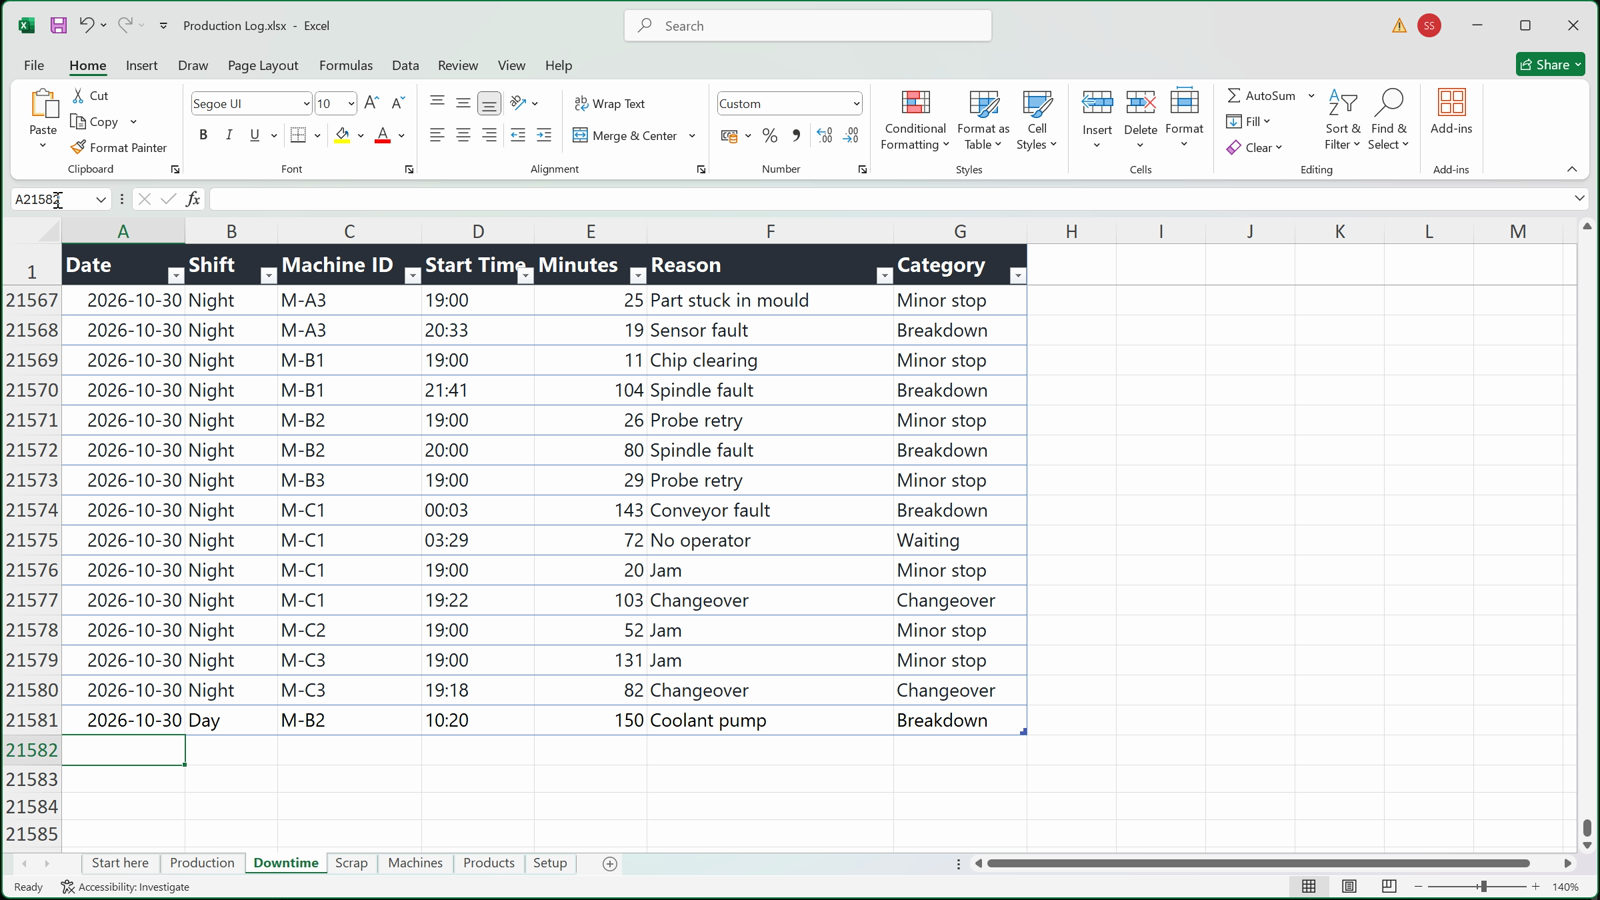
Two CNC 2 breakdowns
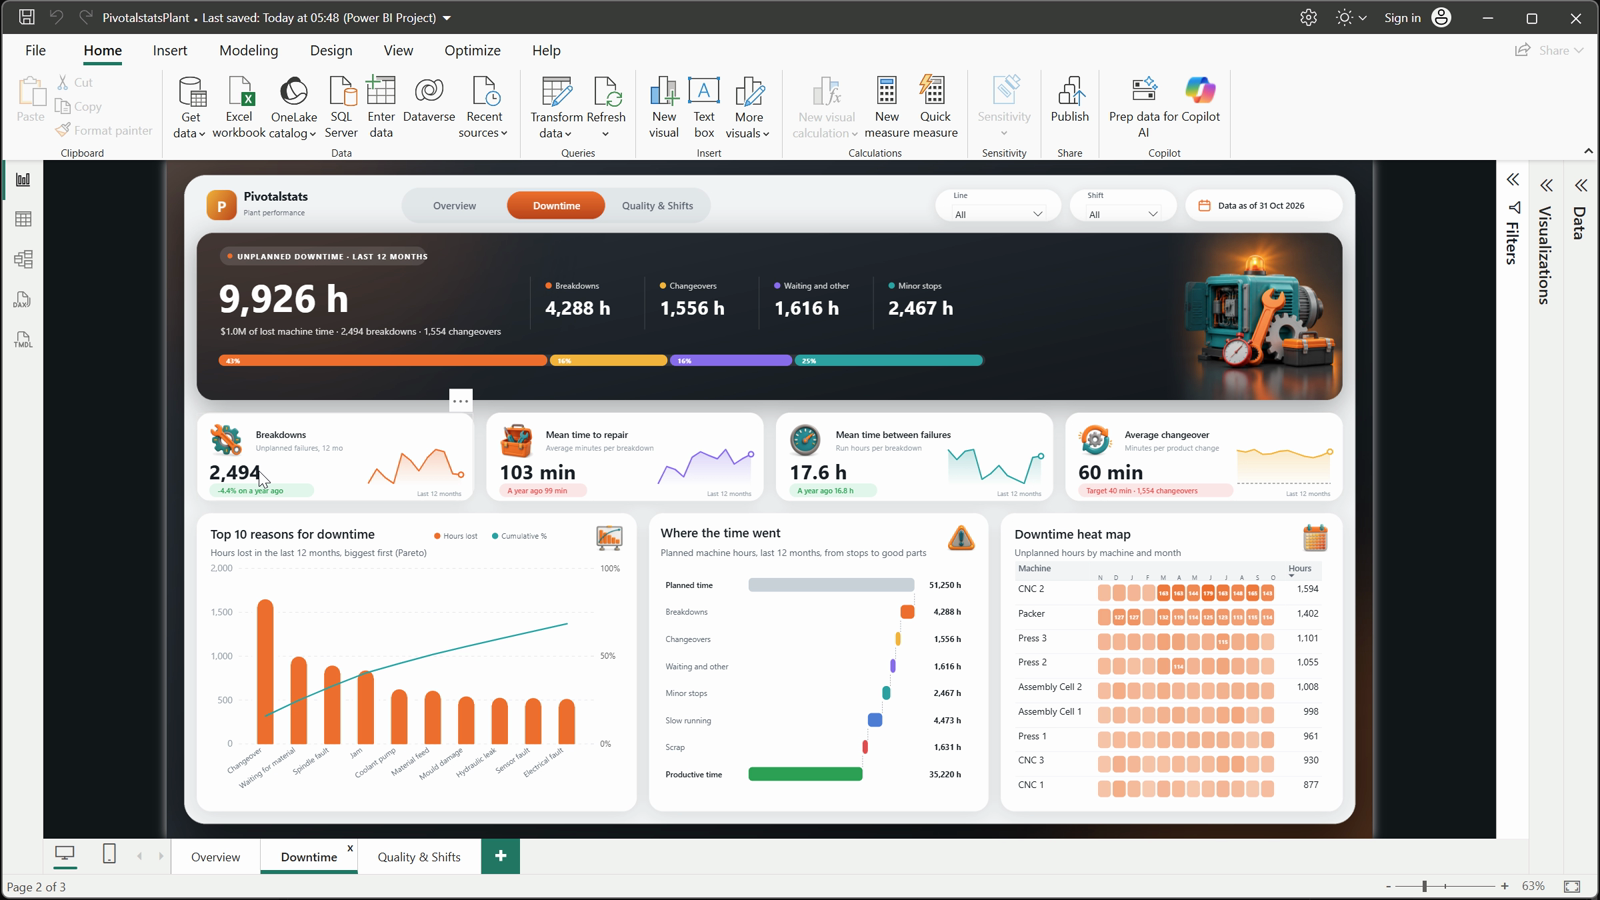
Breakdowns 2,492 > 2,494
Wrap-up
You’ve now built a complete manufacturing OEE dashboard: forgiving Power Query steps for a shift log, a star model with three fact tables, availability, performance and quality measures, OEE over the last 12 months against a target, a downtime Pareto, waterfall and heat map, scrap by shift and product, and an app-style design with a gauge and cards drawn by DAX.
If you’d rather start from the finished file, the ready-made template includes the dashboard, the Excel workbook and a step-by-step setup guide.
Prefer the ready-made template? Get Manufacturing OEE for $19, with the dashboard, the Excel file and a step-by-step guide: Click to Buy
More dashboards: https://www.youtube.com/@PivotalstatsProjects · https://pivotalstats.com