Paste your HR export, click Refresh, and see who is leaving, why, and where to act first.
HR Workforce is a Power BI dashboard for HR managers, people-ops teams and small-business owners who keep their people data in an HR system or Excel. Paste your employee list, absences and job openings into one Excel workbook, click Refresh, and you get headcount, turnover against a target, why people leave, hiring and pay by level.
It answers the questions a people review needs: is turnover going up, which team is losing people, how many leave in their first year, how long hiring takes, and how the pay of women and men compares.
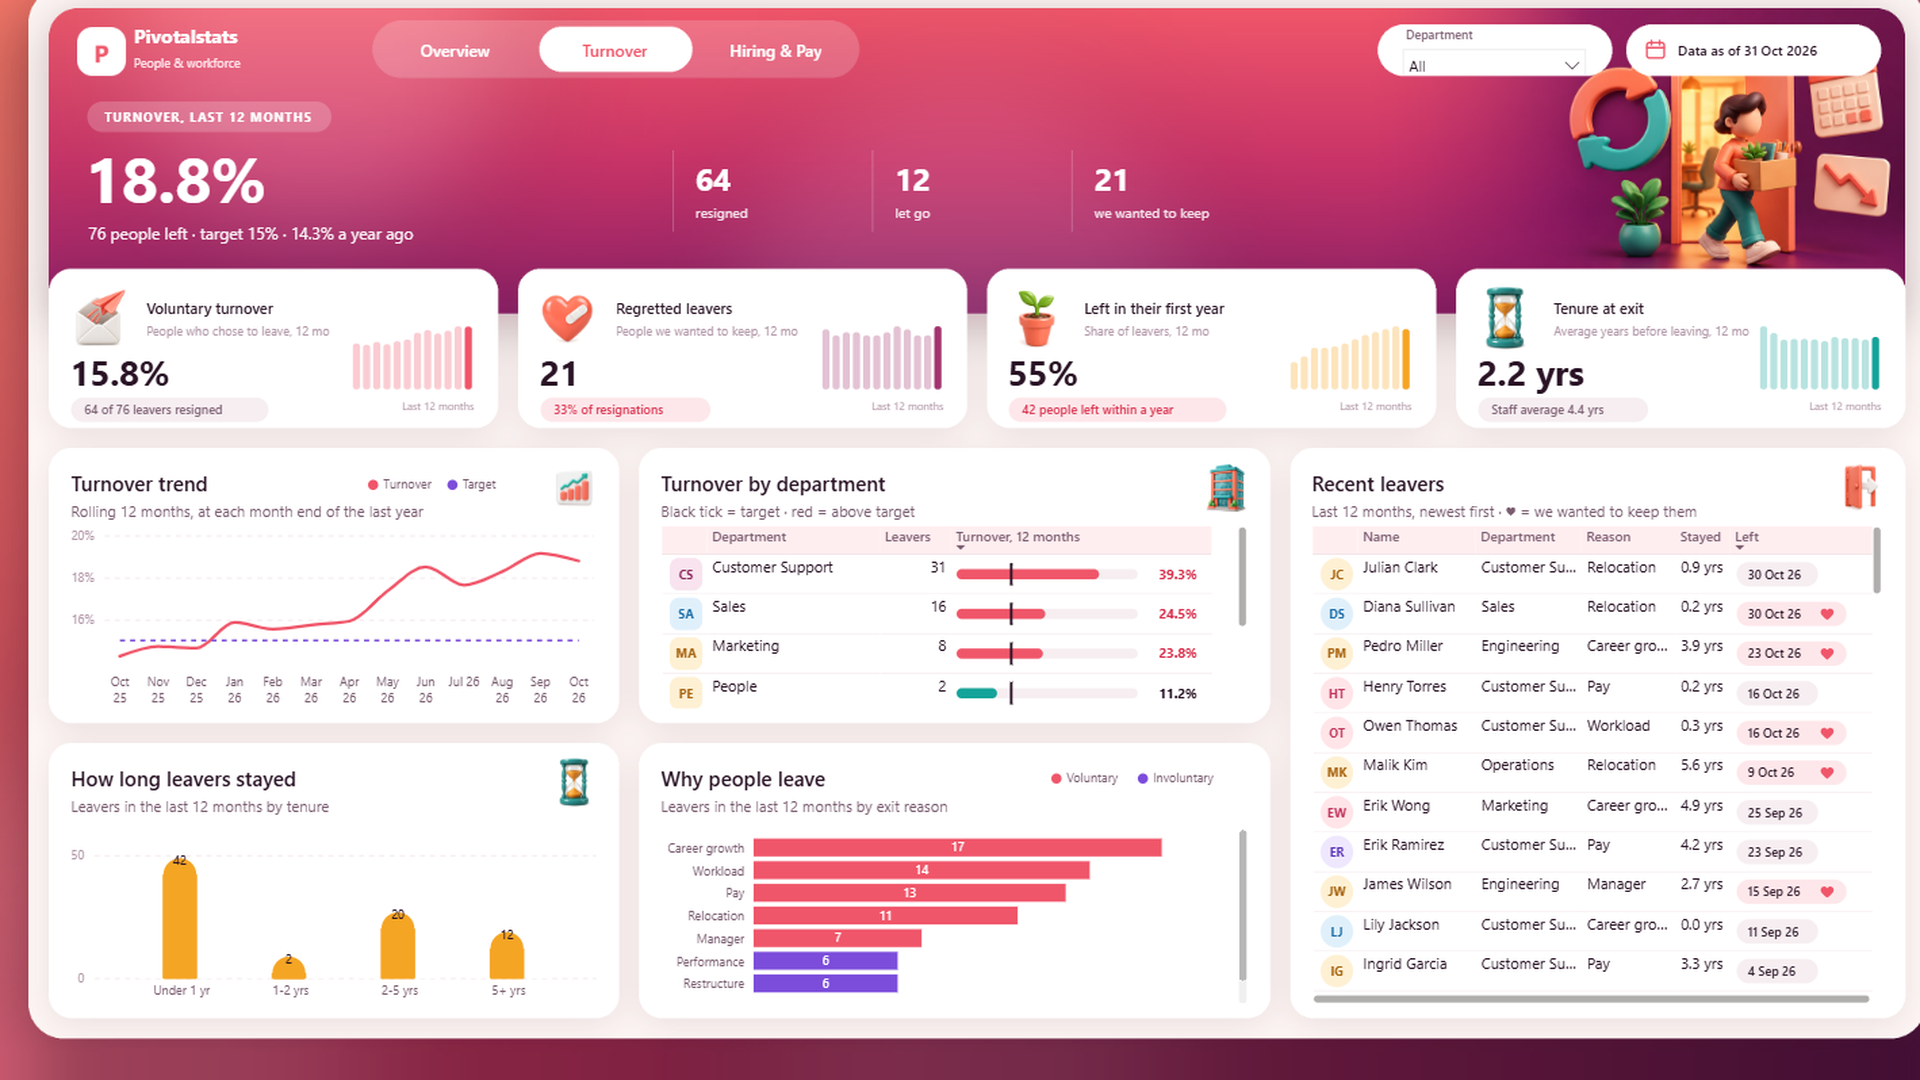
The finished HR Workforce dashboard
Prefer the ready-made template? Get HR Workforce for $19, with the dashboard, the Excel file and a step-by-step guide: Click to Buy
Watch the full build on YouTube: https://www.youtube.com/@PivotalstatsProjects (Click to View)
What you need
- Power BI Desktop from Microsoft (Windows), 2025 or newer
- Microsoft Excel
- The sample data file HR Data.xlsx: Click to Download
What you’ll build
An HR workforce dashboard in Power BI, built from one Excel workbook: headcount and its change over a year, rolling 12-month turnover against a target, why people leave and how long they stayed, absence, the hiring funnel, time to fill, open roles, and the pay of women and men at each level.
It uses Power Query, a small model with inactive relationships to a DAX date table, DAX measures and only Microsoft’s standard visuals. The cards, bars and funnel are SVG measures, and the logo, icons and illustrations are separate objects you can replace.
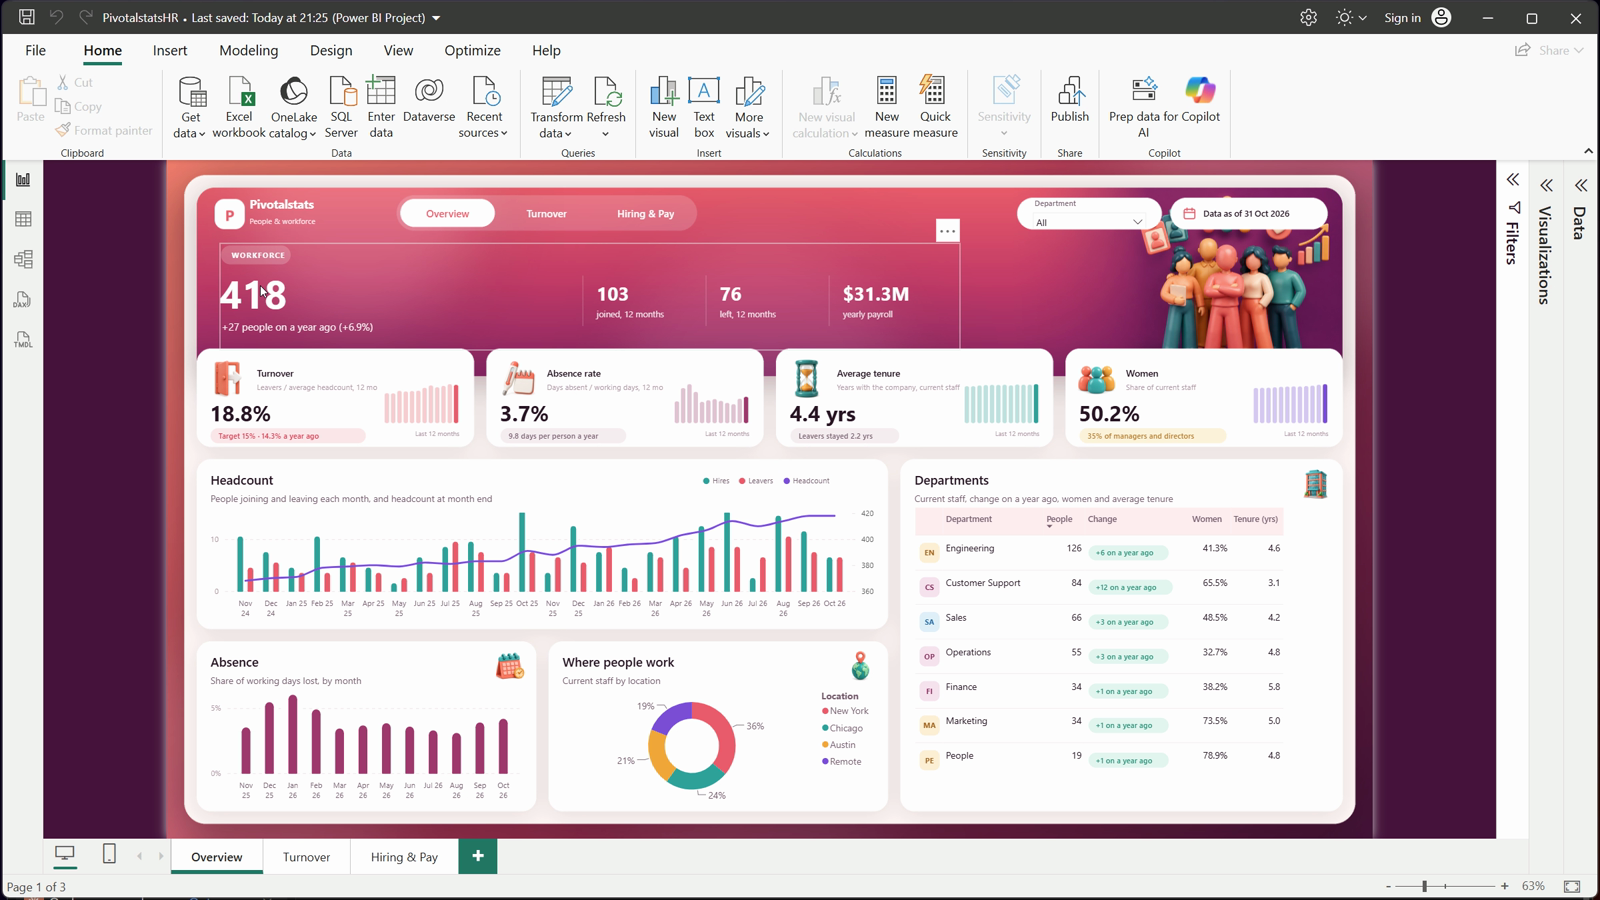
418 people
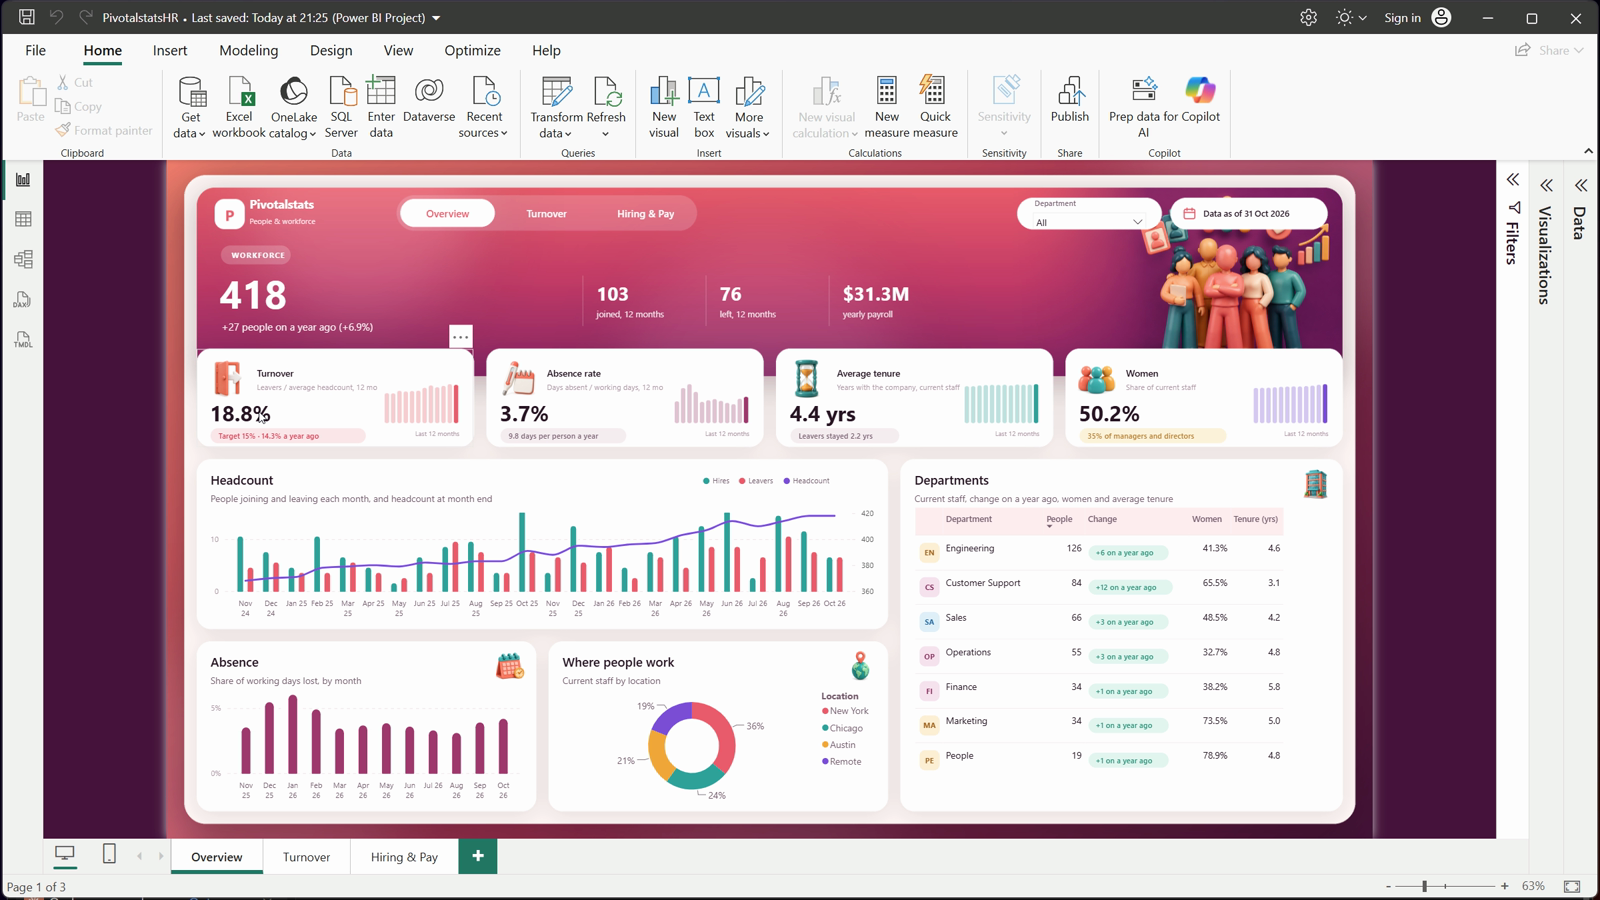
Turnover 18.8%
Step 01: The three pages
Overview: headcount with its change on a year ago, hires, leavers and payroll in the hero band; cards for turnover, absence rate, average tenure and the share of women, each with a 12-month mini chart; hires and leavers by month with the headcount line; and a table of departments.
Turnover: the rolling 12-month trend against the target, turnover by department, why people leave, how long leavers stayed, and the most recent leavers. Hiring & Pay: the hiring funnel, time to fill by department, open roles with their stage, and median pay of women and men by level.
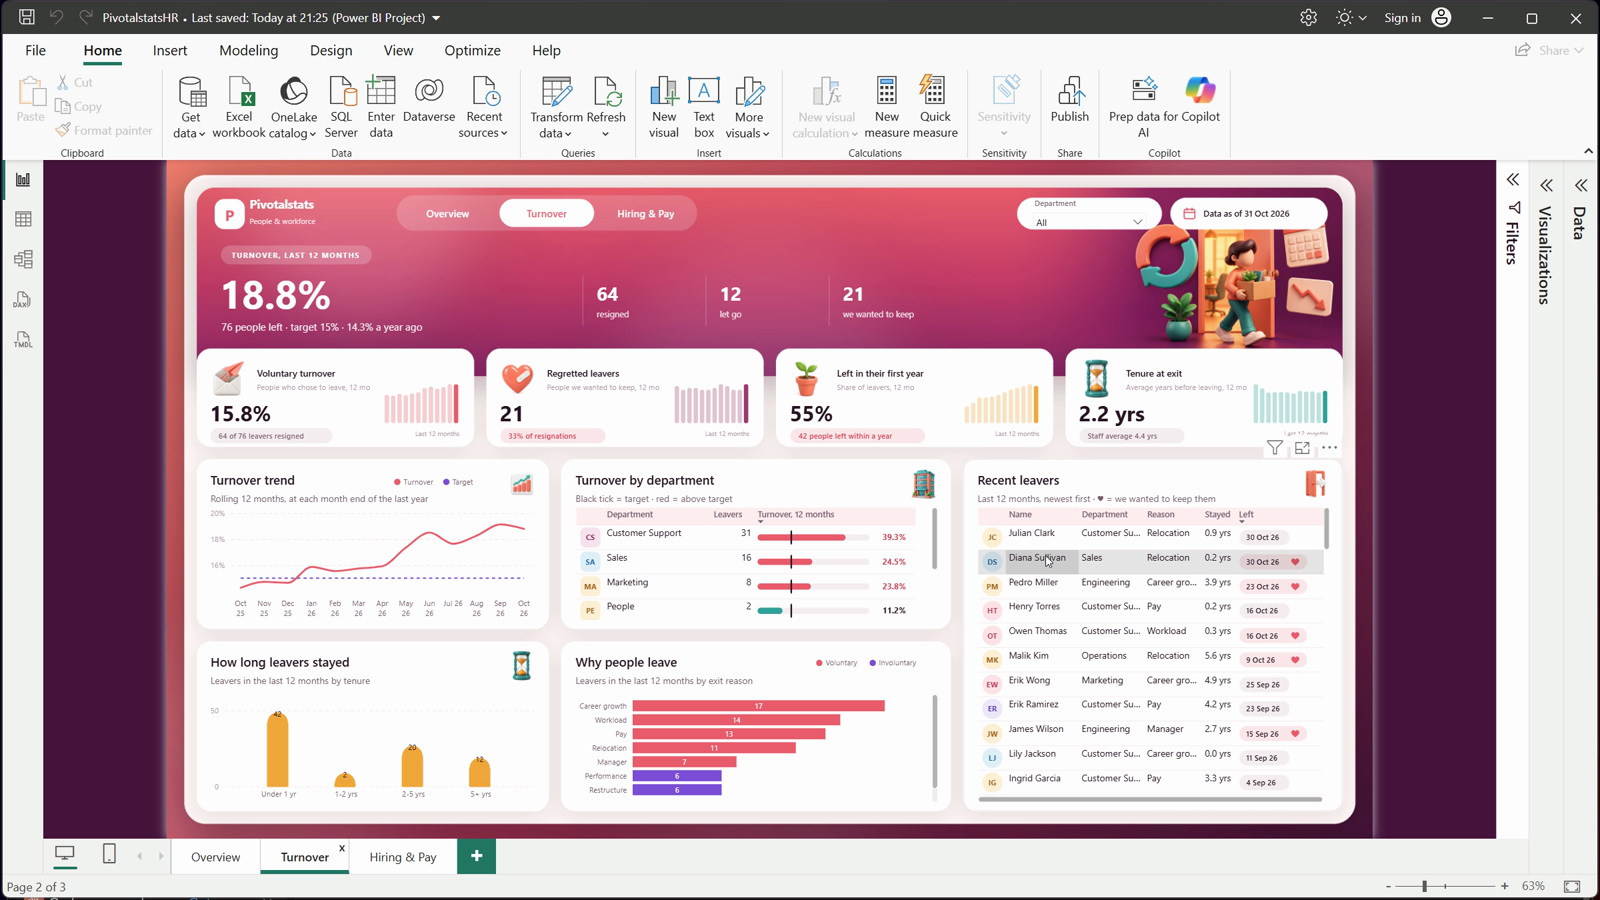
Heart = regretted
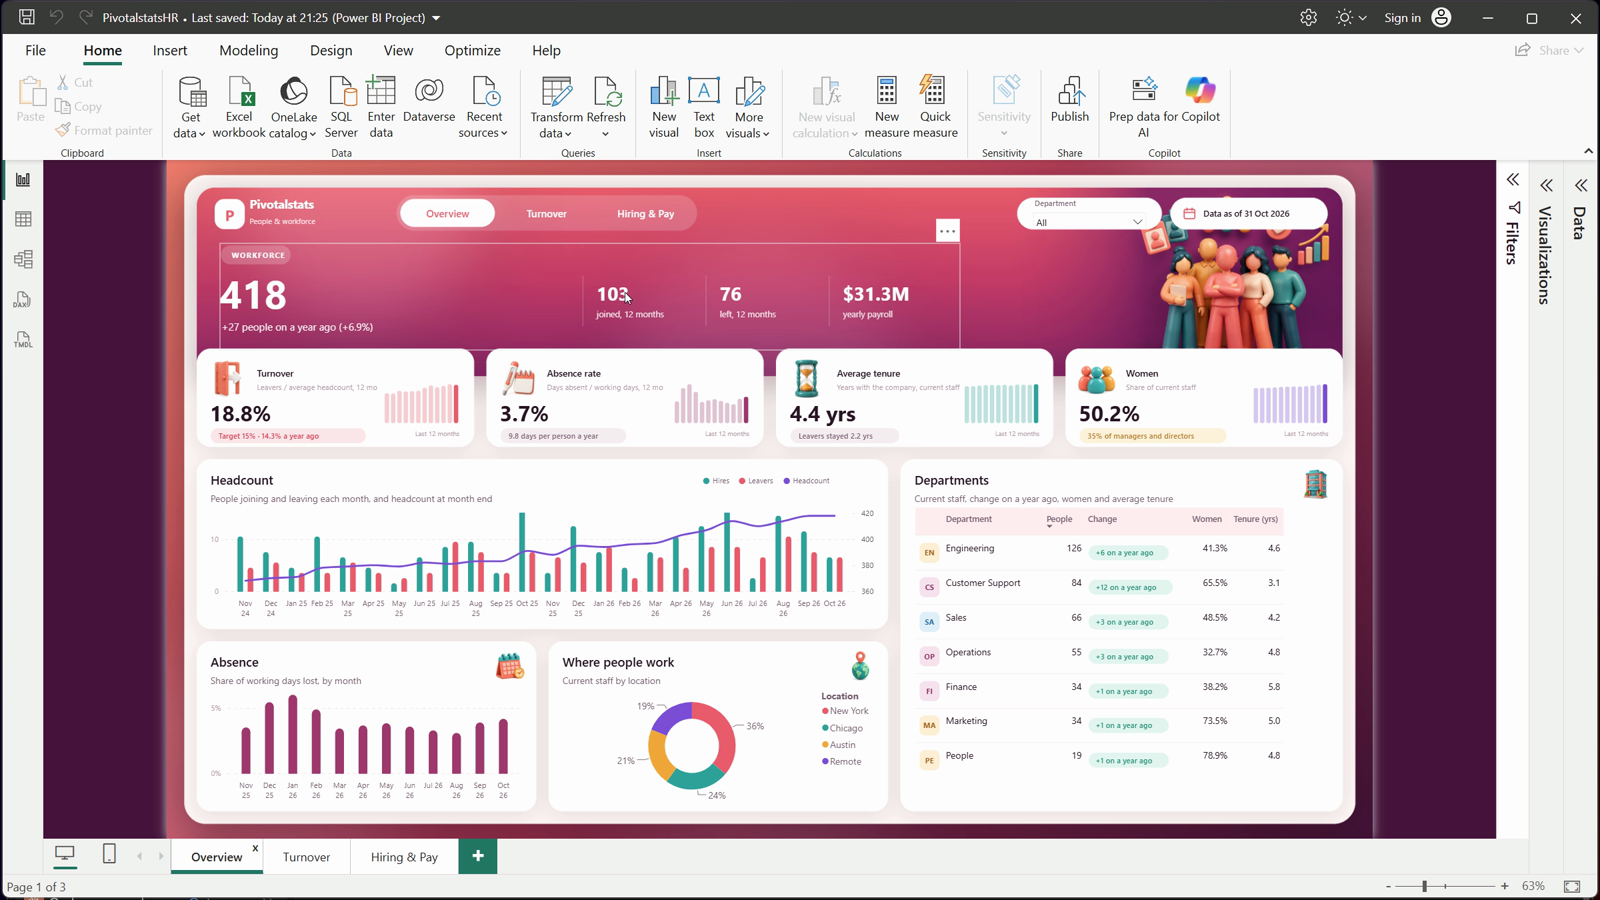
103 joined, 76 left
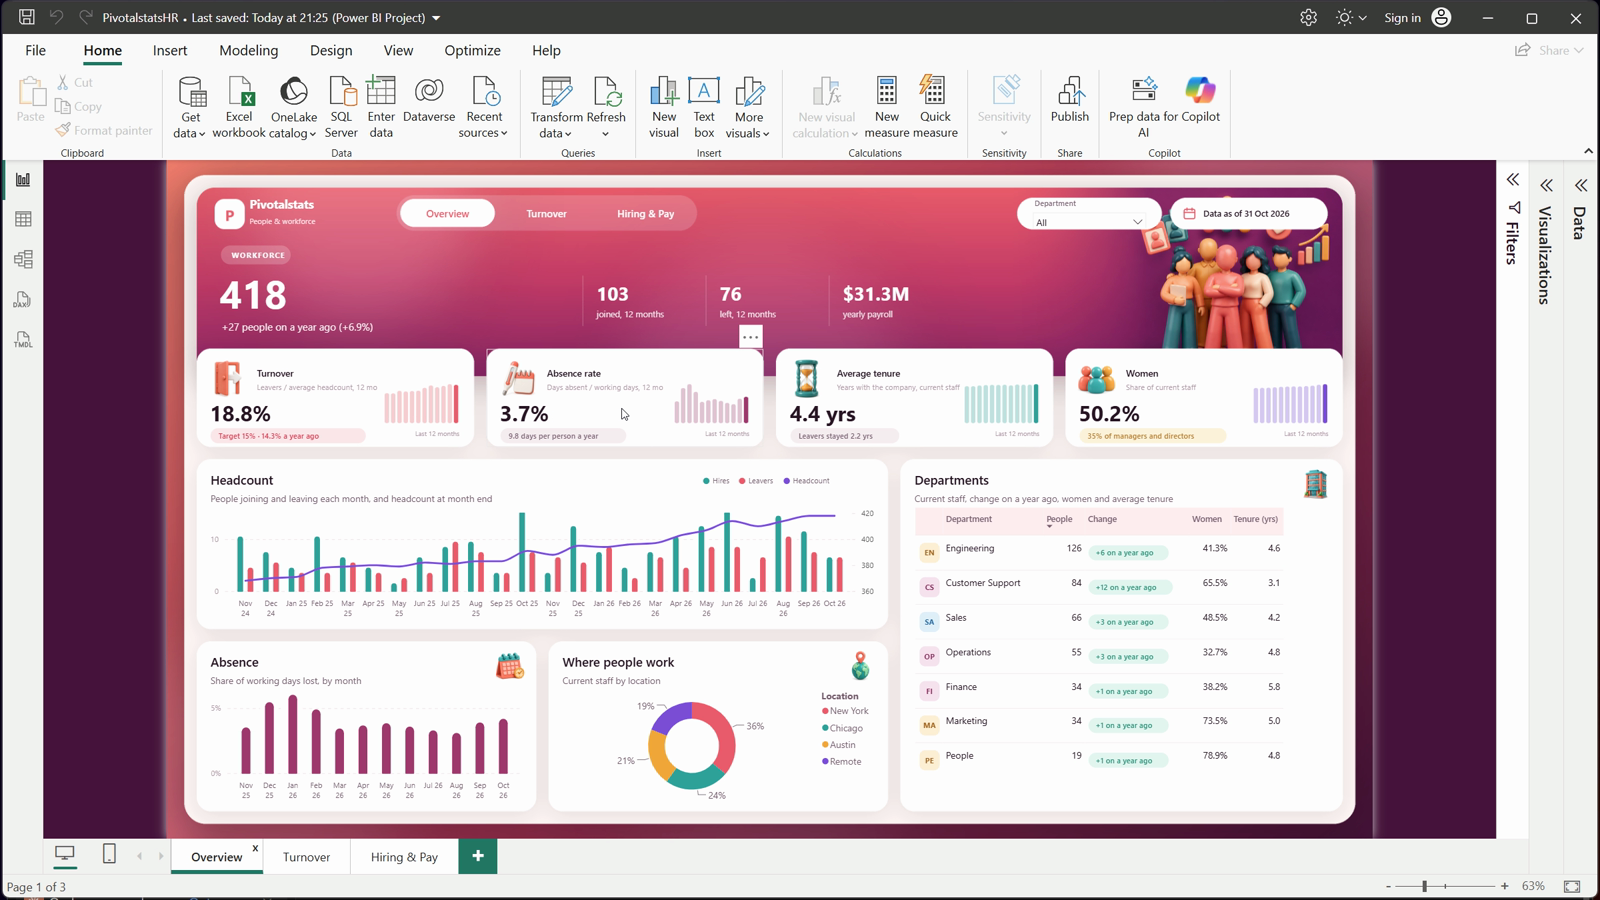
Four KPI cards
Step 02: One Excel workbook, four tables
Employees has one row per person, current staff and leavers, like an HR-system export: department, job title, level, location, gender, hire date, and for leavers the exit date, exit type (Voluntary or Involuntary), exit reason and Regretted (Yes for people you wanted to keep), plus the annual salary.
Absence has one row per absence (employee, first day, working days). Recruitment has one row per job opening with its opened and closed dates, status (Open, Filled or Cancelled) and the counts for each hiring step. Setup holds the report date and the turnover target; leave the date empty to use today.
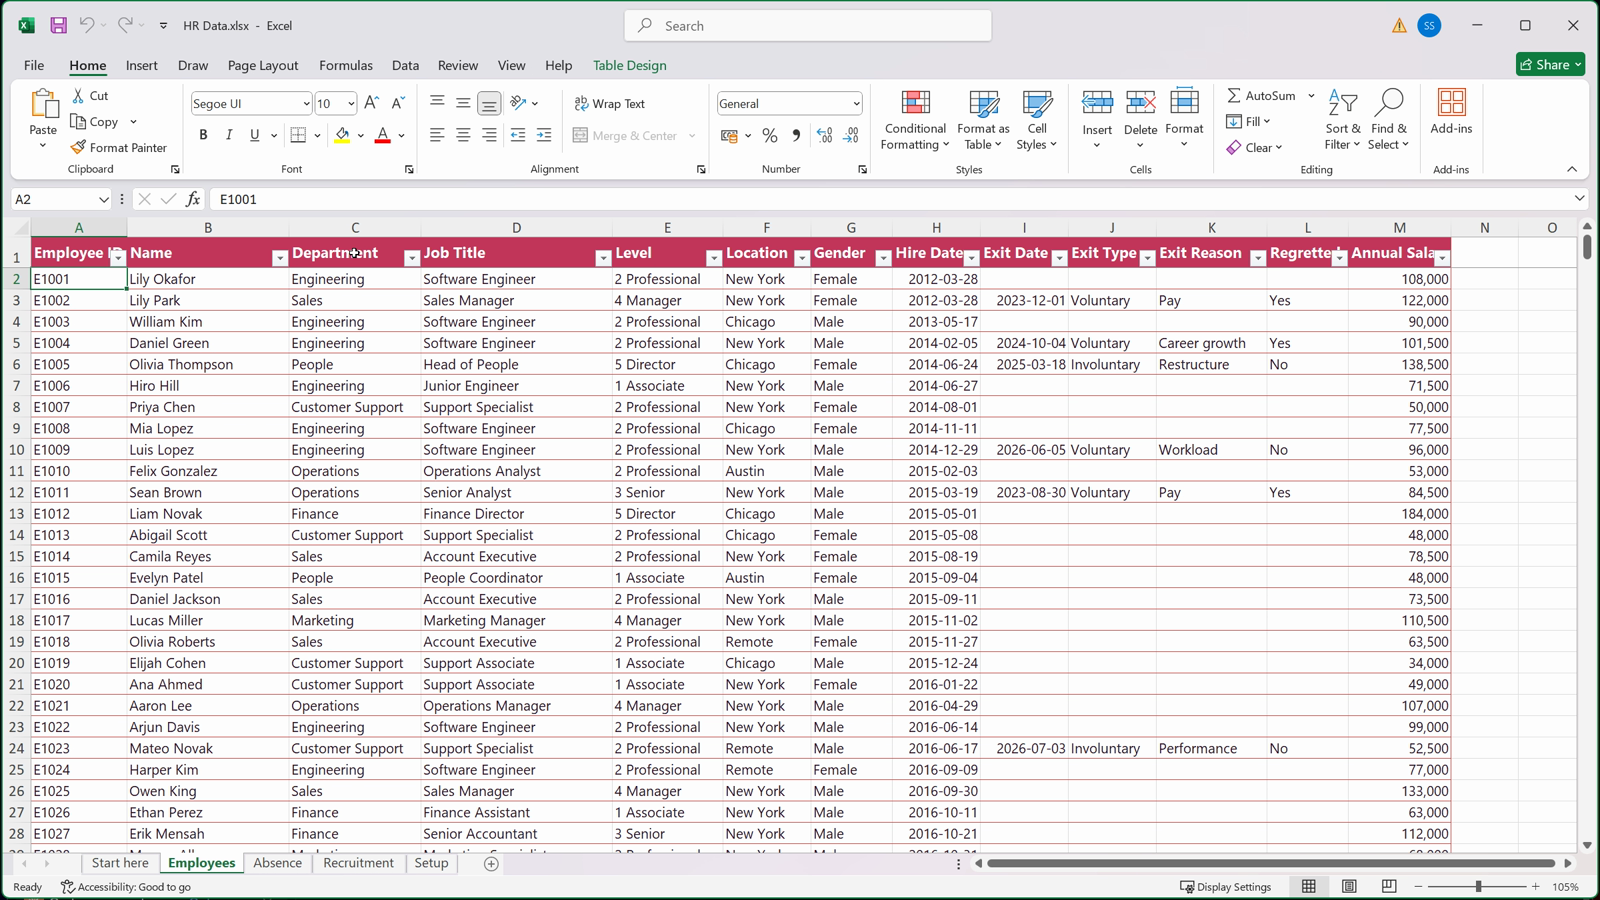
Employees
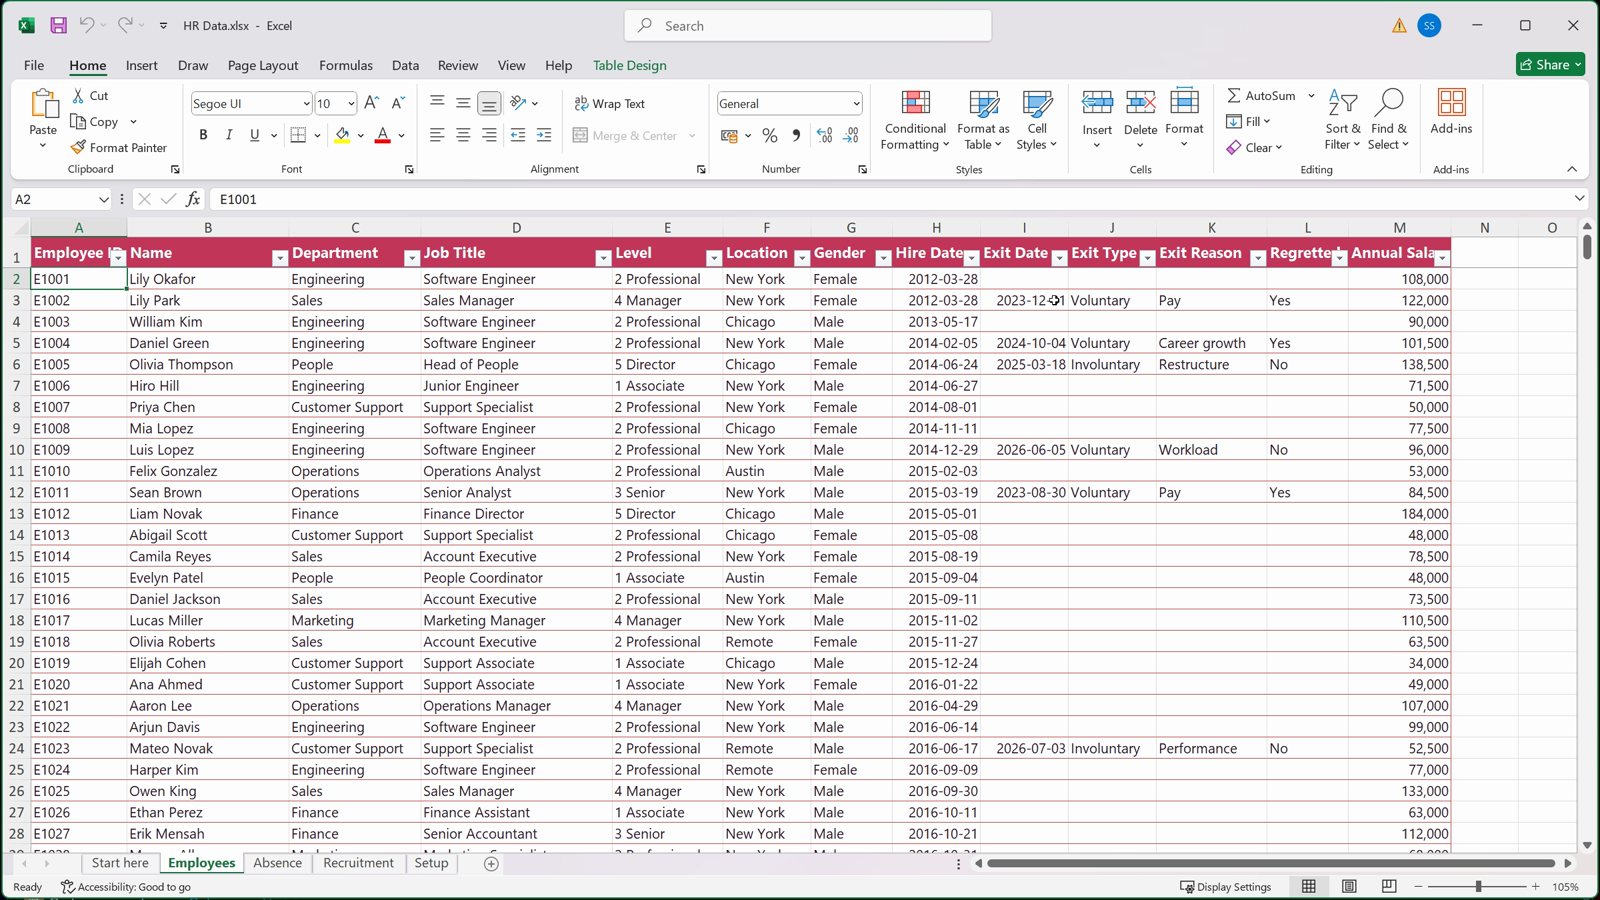
Leavers
Step 03: Connect with one parameter
In Power Query, create a text parameter called DataFile that holds the full path to the workbook. Every query reads from it, so moving the file means changing one value.
Then add a blank query called Workbook that opens the file with Excel.Workbook. It lists the sheets and the tables; always read the tables, because they grow with your data. Switch off Enable load: it is only the shared source for the other queries.
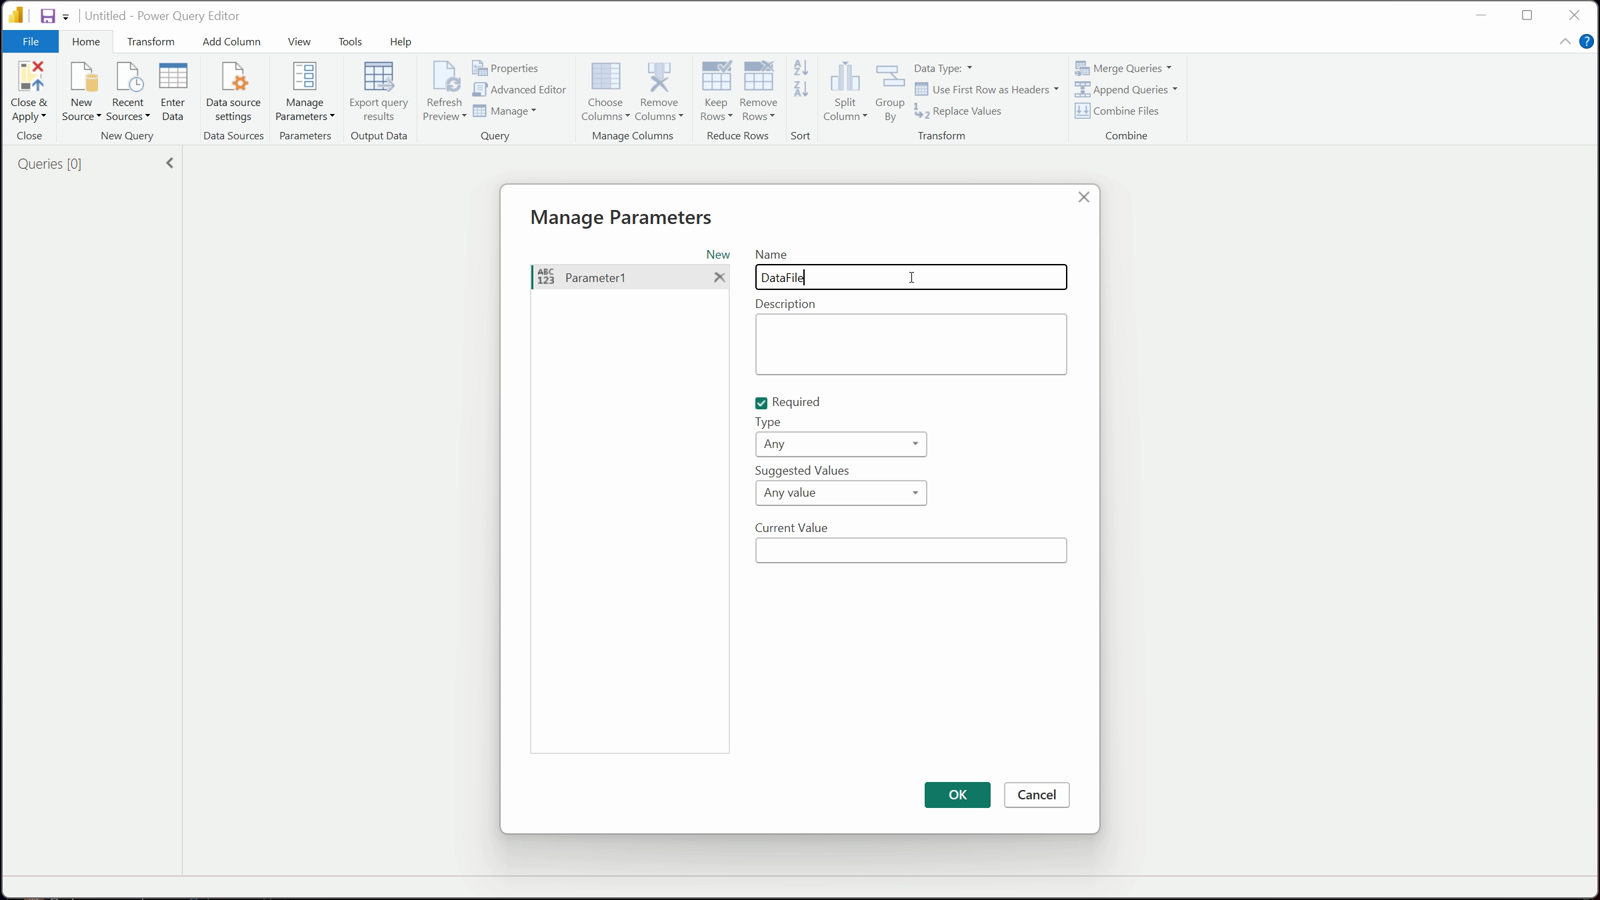
DataFile parameter
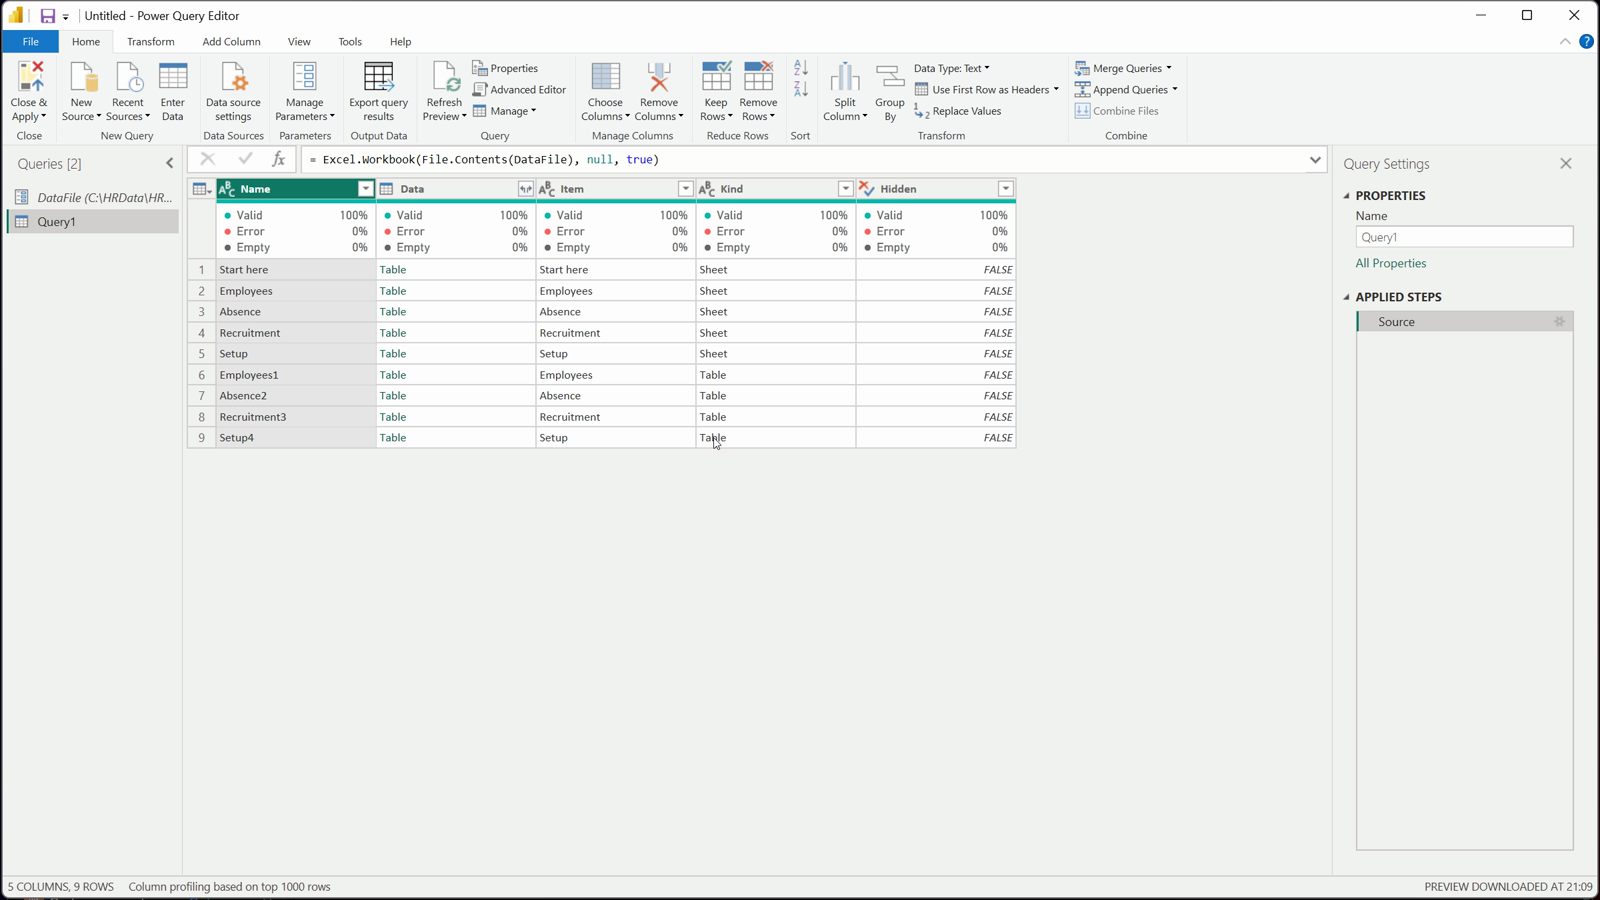
Read the tables
M
let
Source = Excel.Workbook(File.Contents(DataFile), null, true)
in
Source
Step 04: Clean the employee export
EmployeesRaw selects the thirteen columns by name with MissingField.UseNull, so a missing column arrives empty instead of breaking the refresh. It renames, trims and types the columns, removes rows whose dates or salary fail to convert, and keeps everyone with a name and a hire date.
Defaults fill the gaps: Unassigned for a missing department, placeholders for level, location and gender. Filled Exits only changes leavers: an empty exit type becomes Voluntary, a missing reason Not given, and Regretted defaults to No. Missing IDs come from the row number, and duplicates are removed because the ID is the key for absences.
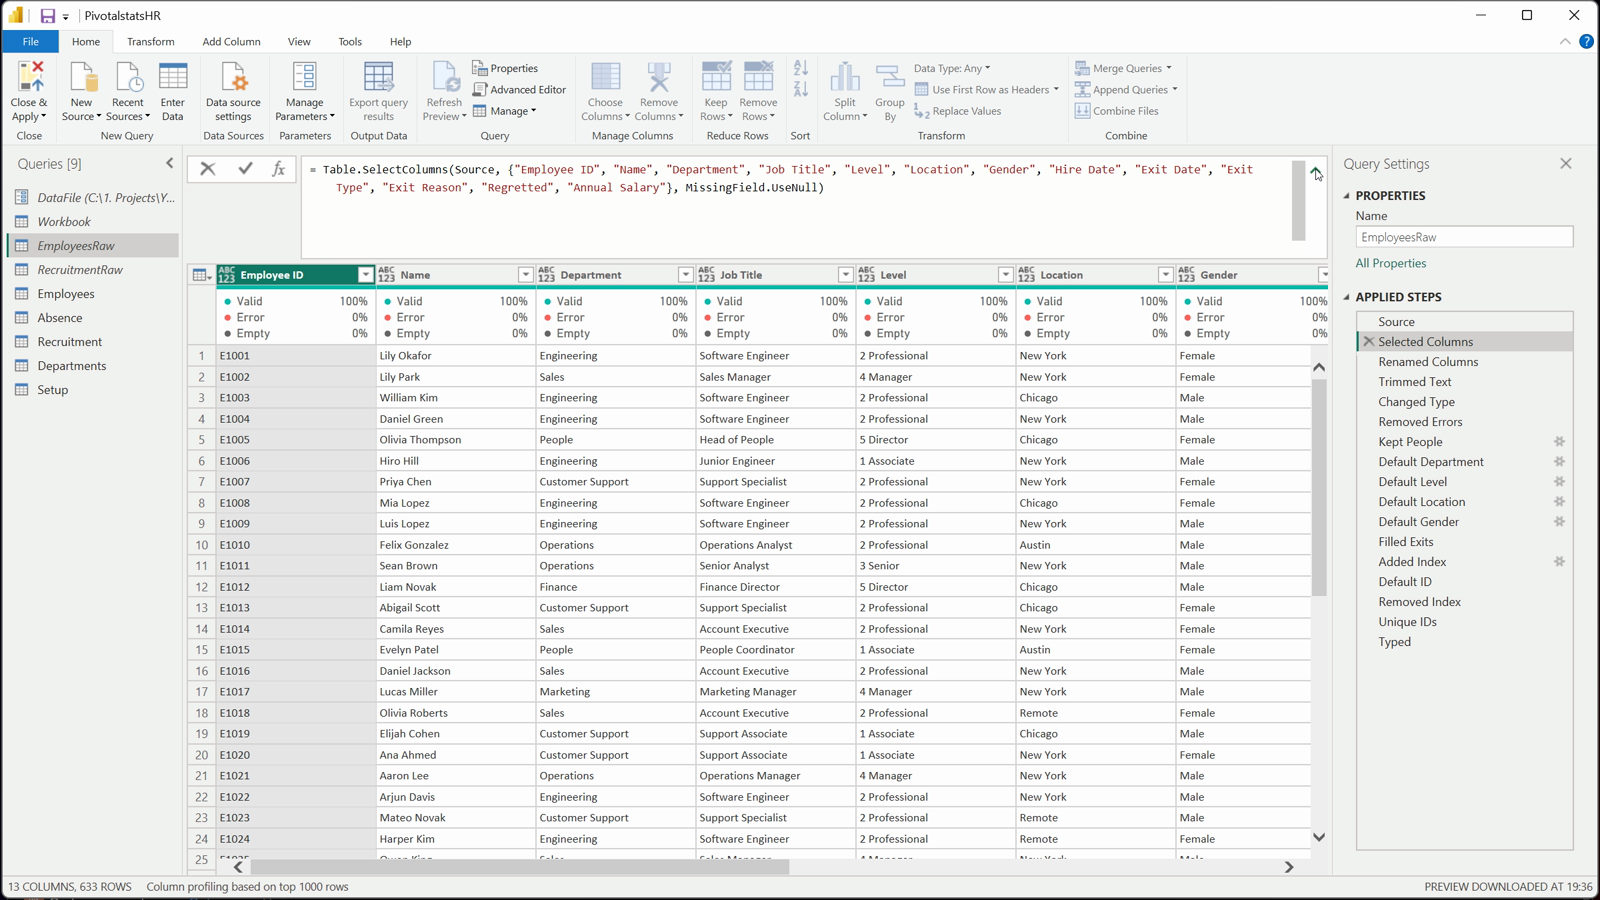
MissingField.UseNull
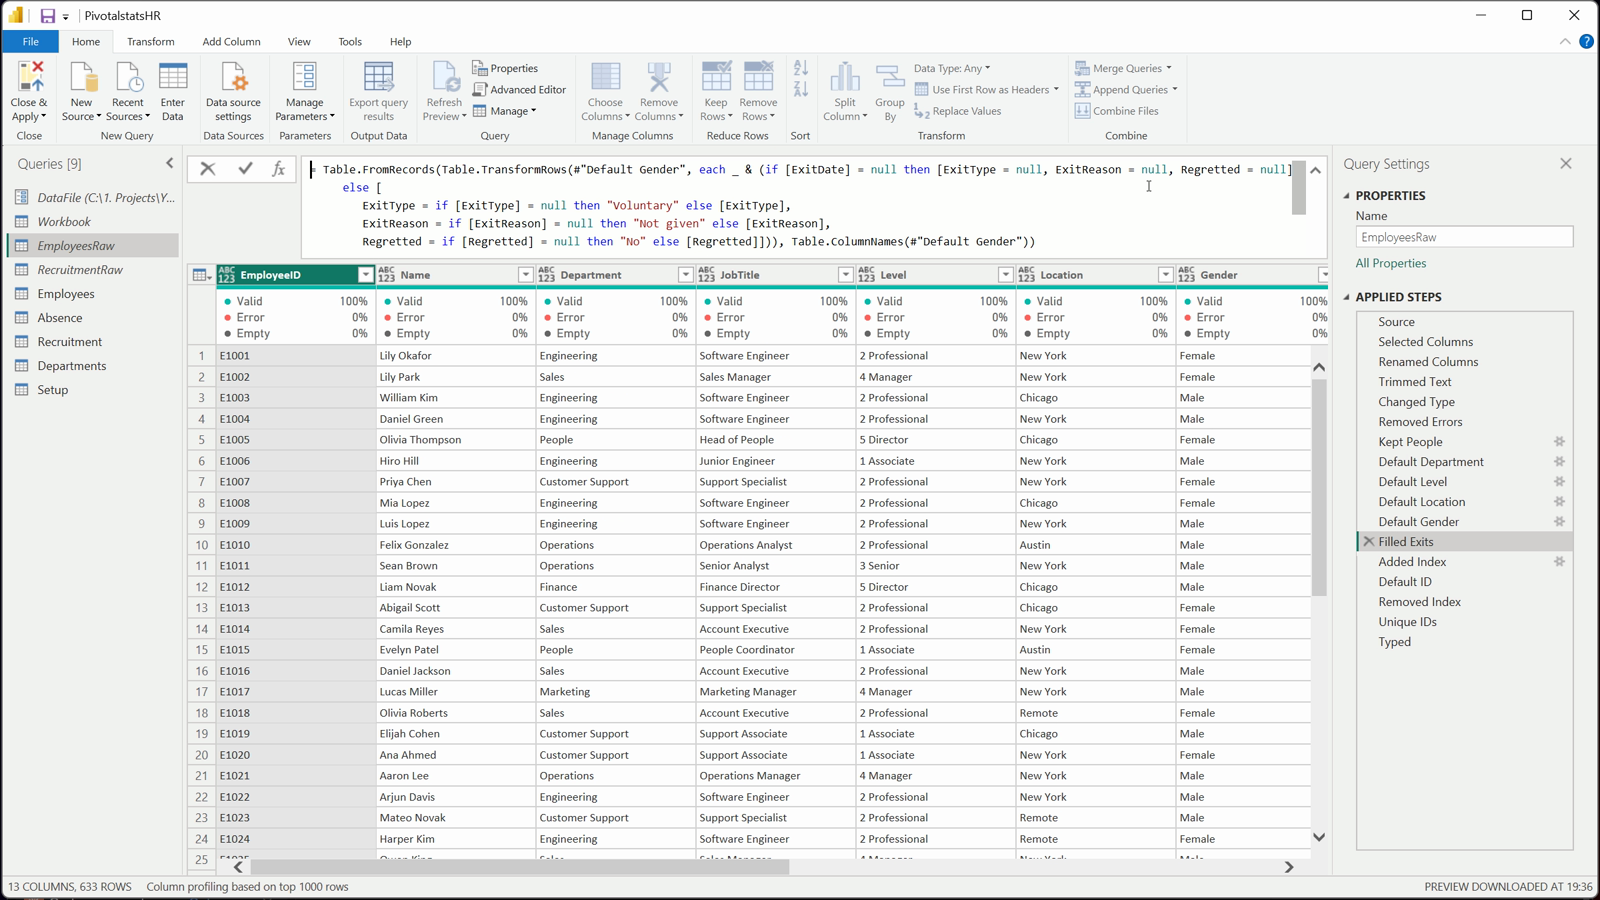
Filled Exits
M
let

      Source = Workbook{[Item = "Employees", Kind = "Table"]}[Data],

      #"Selected Columns" = Table.SelectColumns(Source, {"Employee ID", "Name", "Department", "Job Title", "Level", "Location", "Gender", "Hire Date", "Exit Date", "Exit Type", "Exit Reason", "Regretted", "Annual Salary"}, MissingField.UseNull),

      #"Renamed Columns" = Table.RenameColumns(#"Selected Columns", {{"Employee ID", "EmployeeID"}, {"Job Title", "JobTitle"}, {"Hire Date", "HireDate"}, {"Exit Date", "ExitDate"}, {"Exit Type", "ExitType"}, {"Exit Reason", "ExitReason"}, {"Annual Salary", "Salary"}}),

      #"Trimmed Text" = Table.TransformColumns(#"Renamed Columns", {{"EmployeeID", each if _ = null then null else Text.Trim(Text.From(_)), type text}, {"Name", each if _ = null then null else Text.Trim(Text.From(_)), type text}, {"Department", each if _ = null then null else Text.Trim(Text.From(_)), type text}, {"JobTitle", each if _ = null then null else Text.Trim(Text.From(_)), type text}, {"Level", each if _ = null then null else Text.Trim(Text.From(_)), type text}, {"Location", each if _ = null then null else Text.Trim(Text.From(_)), type text}, {"Gender", each if _ = null then null else Text.Trim(Text.From(_)), type text}, {"ExitType", each if _ = null then null else Text.Trim(Text.From(_)), type text}, {"ExitReason", each if _ = null then null else Text.Trim(Text.From(_)), type text}, {"Regretted", each if _ = null then null else Text.Trim(Text.From(_)), type text}}),

      #"Changed Type" = Table.TransformColumnTypes(#"Trimmed Text", {{"HireDate", type date}, {"ExitDate", type date}, {"Salary", type number}}, "en-US"),

      #"Removed Errors" = Table.RemoveRowsWithErrors(#"Changed Type", {"HireDate", "ExitDate", "Salary"}),

      #"Kept People" = Table.SelectRows(#"Removed Errors", each [Name] <> null and [Name] <> "" and [HireDate] <> null),

      #"Default Department" = Table.ReplaceValue(#"Kept People", null, "Unassigned", Replacer.ReplaceValue, {"Department"}),

      #"Default Level" = Table.ReplaceValue(#"Default Department", null, "Unknown", Replacer.ReplaceValue, {"Level"}),

      #"Default Location" = Table.ReplaceValue(#"Default Level", null, "Unknown", Replacer.ReplaceValue, {"Location"}),

      #"Default Gender" = Table.ReplaceValue(#"Default Location", null, "Not stated", Replacer.ReplaceValue, {"Gender"}),

      #"Filled Exits" = Table.FromRecords(Table.TransformRows(#"Default Gender", each _ & (if [ExitDate] = null then [ExitType = null, ExitReason = null, Regretted = null] else [

          ExitType = if [ExitType] = null then "Voluntary" else [ExitType],

          ExitReason = if [ExitReason] = null then "Not given" else [ExitReason],

          Regretted = if [Regretted] = null then "No" else [Regretted]])), Table.ColumnNames(#"Default Gender")),

      #"Added Index" = Table.AddIndexColumn(#"Filled Exits", "Row", 1, 1, Int64.Type),

      #"Default ID" = Table.FromRecords(Table.TransformRows(#"Added Index", each _ & [EmployeeID = if [EmployeeID] = null or [EmployeeID] = "" then "E" & Text.PadStart(Text.From([Row]), 5, "0") else [EmployeeID]]), Table.ColumnNames(#"Added Index")),

      #"Removed Index" = Table.RemoveColumns(#"Default ID", {"Row"}),

      #"Unique IDs" = Table.Distinct(#"Removed Index", {"EmployeeID"}),

      #"Typed" = Table.TransformColumnTypes(#"Unique IDs", {{"EmployeeID", type text}, {"Name", type text}, {"Department", type text}, {"JobTitle", type text}, {"Level", type text}, {"Location", type text}, {"Gender", type text}, {"HireDate", type date}, {"ExitDate", type date}, {"ExitType", type text}, {"ExitReason", type text}, {"Regretted", type text}, {"Salary", type number}})

  in

#"Typed"
Step 05: Absence, recruitment and departments
Absence types its four columns and counts a missing number of days as one. RecruitmentRaw does the same for job openings; an empty status becomes Open when there is no closed date, and Filled when there is one.
Departments combines the department names from the employees and the job openings and removes duplicates, so a team that is hiring its first person still appears. Setup reads the report date and the turnover target.
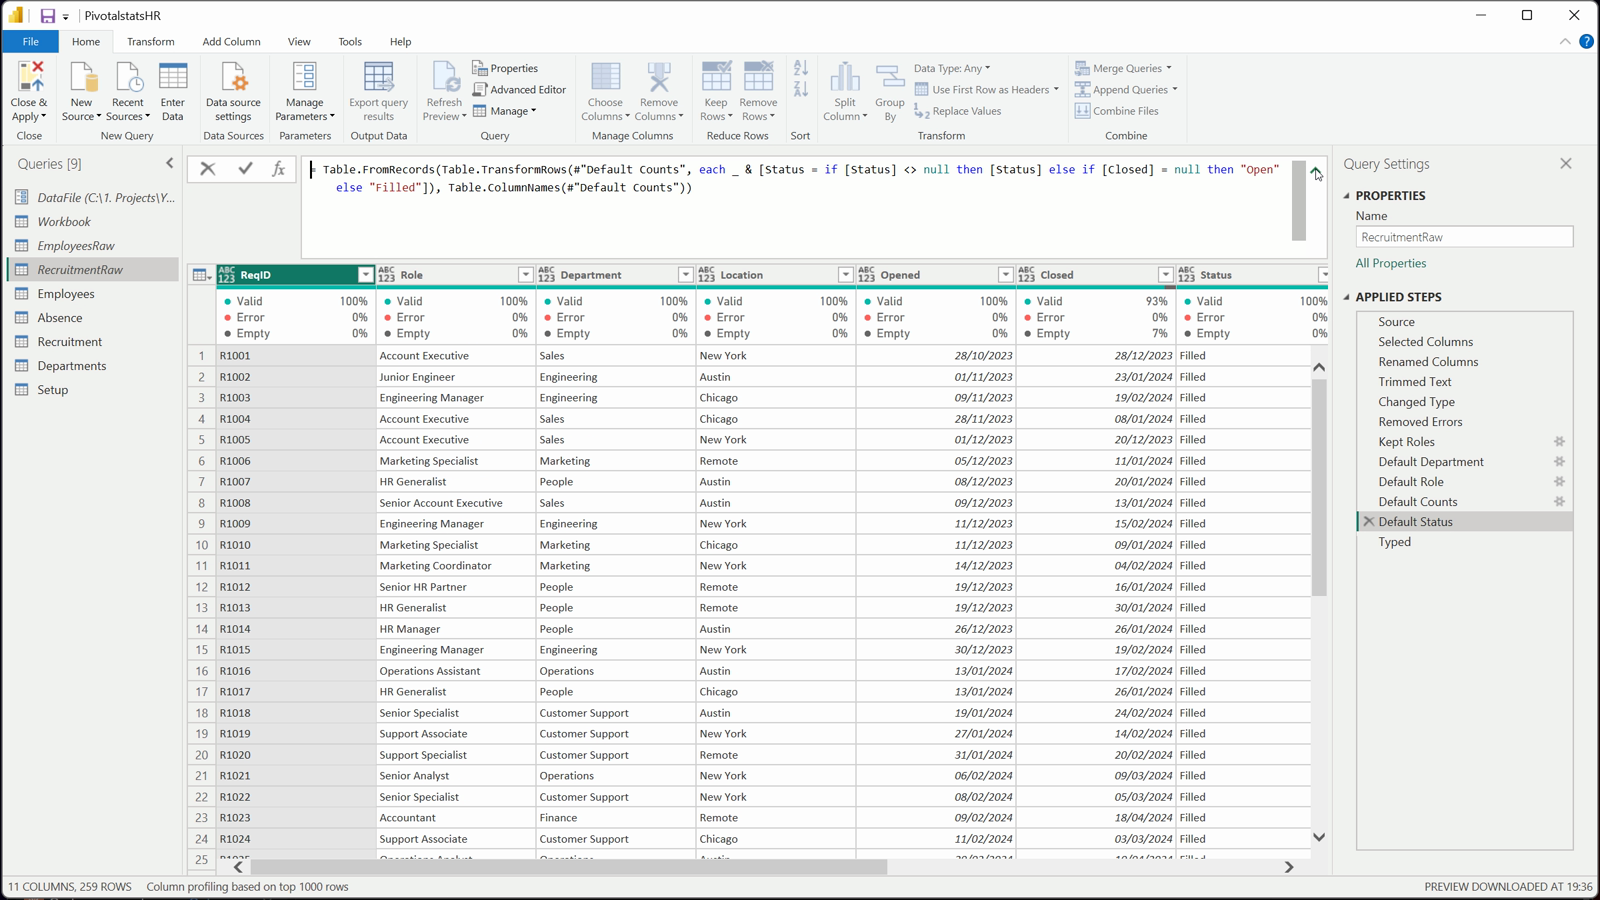
Default Status
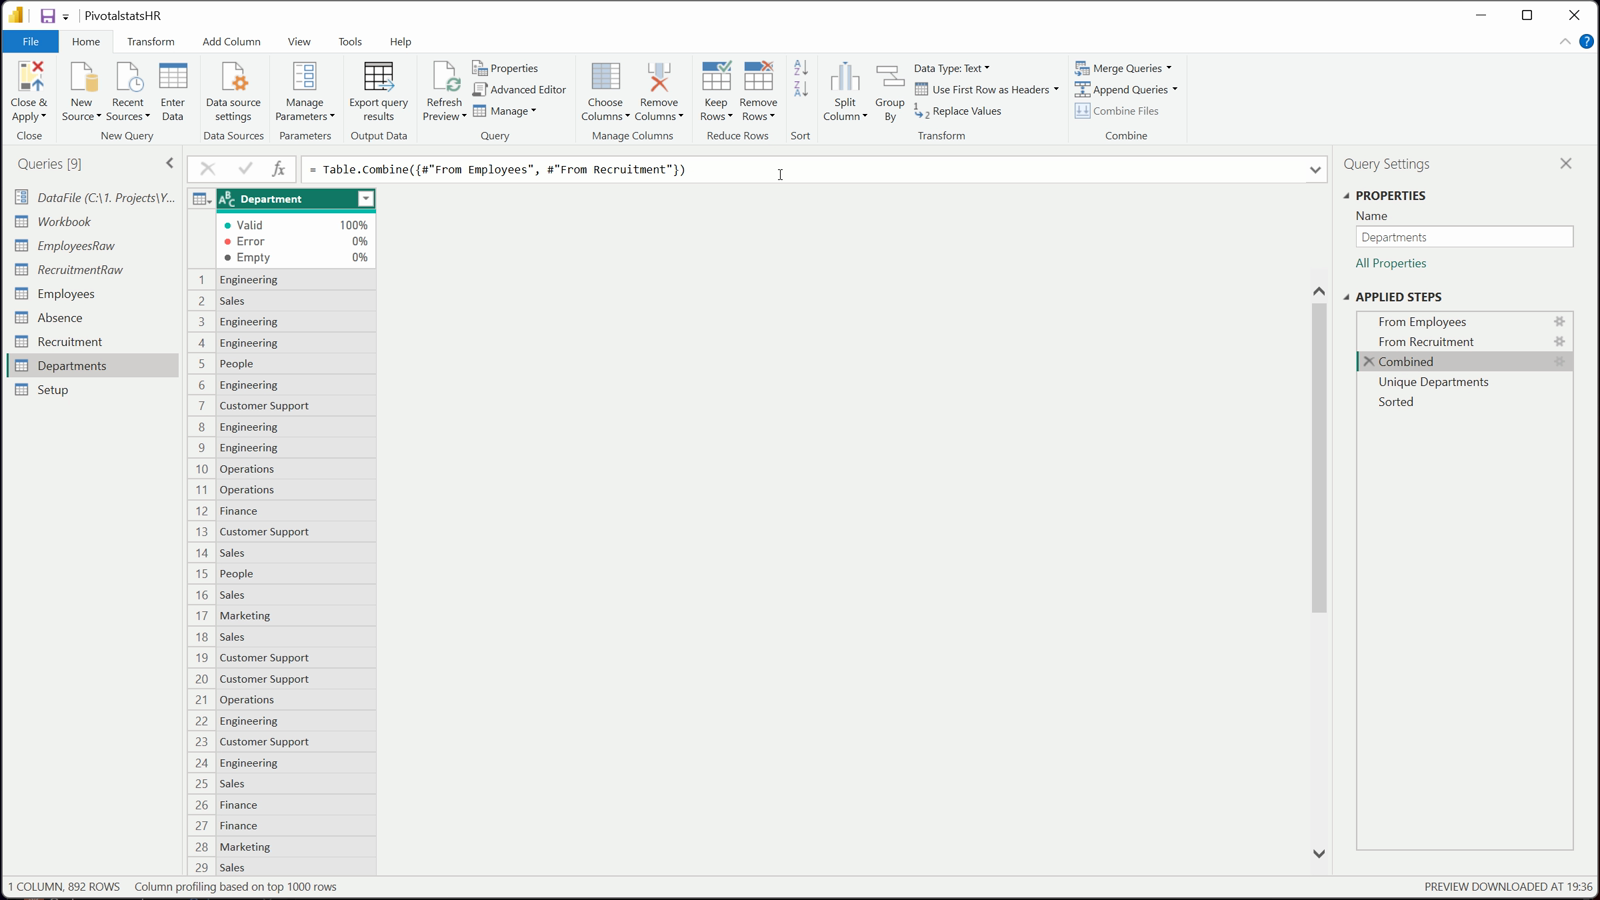
Departments
M
let

      #"From Employees" = Table.SelectColumns(EmployeesRaw, {"Department"}),

      #"From Recruitment" = Table.SelectColumns(RecruitmentRaw, {"Department"}),

      #"Combined" = Table.Combine({#"From Employees", #"From Recruitment"}),

      #"Unique Departments" = Table.Distinct(#"Combined"),

      #"Sorted" = Table.Sort(#"Unique Departments", {{"Department", Order.Ascending}})

  in

      #"Sorted"

M

  let

      Source = Workbook{[Item = "Recruitment", Kind = "Table"]}[Data],

      #"Selected Columns" = Table.SelectColumns(Source, {"Req ID", "Role", "Department", "Location", "Opened", "Closed", "Status", "Applicants", "Screened", "Interviewed", "Offers"}, MissingField.UseNull),

      #"Renamed Columns" = Table.RenameColumns(#"Selected Columns", {{"Req ID", "ReqID"}}),

      #"Trimmed Text" = Table.TransformColumns(#"Renamed Columns", {{"ReqID", each if _ = null then null else Text.Trim(Text.From(_)), type text}, {"Role", each if _ = null then null else Text.Trim(Text.From(_)), type text}, {"Department", each if _ = null then null else Text.Trim(Text.From(_)), type text}, {"Location", each if _ = null then null else Text.Trim(Text.From(_)), type text}, {"Status", each if _ = null then null else Text.Trim(Text.From(_)), type text}}),

      #"Changed Type" = Table.TransformColumnTypes(#"Trimmed Text", {{"Opened", type date}, {"Closed", type date}, {"Applicants", Int64.Type}, {"Screened", Int64.Type}, {"Interviewed", Int64.Type}, {"Offers", Int64.Type}}, "en-US"),

      #"Removed Errors" = Table.RemoveRowsWithErrors(#"Changed Type", {"Opened", "Closed", "Applicants", "Screened", "Interviewed", "Offers"}),

      #"Kept Roles" = Table.SelectRows(#"Removed Errors", each [Opened] <> null),

      #"Default Department" = Table.ReplaceValue(#"Kept Roles", null, "Unassigned", Replacer.ReplaceValue, {"Department"}),

      #"Default Role" = Table.ReplaceValue(#"Default Department", null, "Open role", Replacer.ReplaceValue, {"Role"}),

      #"Default Counts" = Table.ReplaceValue(#"Default Role", null, 0, Replacer.ReplaceValue, {"Applicants", "Screened", "Interviewed", "Offers"}),

      #"Default Status" = Table.FromRecords(Table.TransformRows(#"Default Counts", each _ & [Status = if [Status] <> null then [Status] else if [Closed] = null then "Open" else "Filled"]), Table.ColumnNames(#"Default Counts")),

      #"Typed" = Table.TransformColumnTypes(#"Default Status", {{"ReqID", type text}, {"Role", type text}, {"Department", type text}, {"Location", type text}, {"Opened", type date}, {"Closed", type date}, {"Status", type text}, {"Applicants", Int64.Type}, {"Screened", Int64.Type}, {"Interviewed", Int64.Type}, {"Offers", Int64.Type}})

  in

#"Typed"
Step 06: A date table and three inactive relationships
The Date table is DAX: it reads the report date from Setup (or uses TODAY) and runs from January three years earlier to the end of the report month. Month Year labels the charts and MonthOffset lets a measure show exactly the last 24 months. Mark it as a date table.
Employees and Recruitment point to Departments, and Absence points to Employees. An employee has two dates, so Employees gets two relationships to Date (HireDate and ExitDate) and Absence one (StartDate). All three are inactive: a measure switches one on with USERELATIONSHIP, so the same calendar counts hires in one measure and leavers in the next.
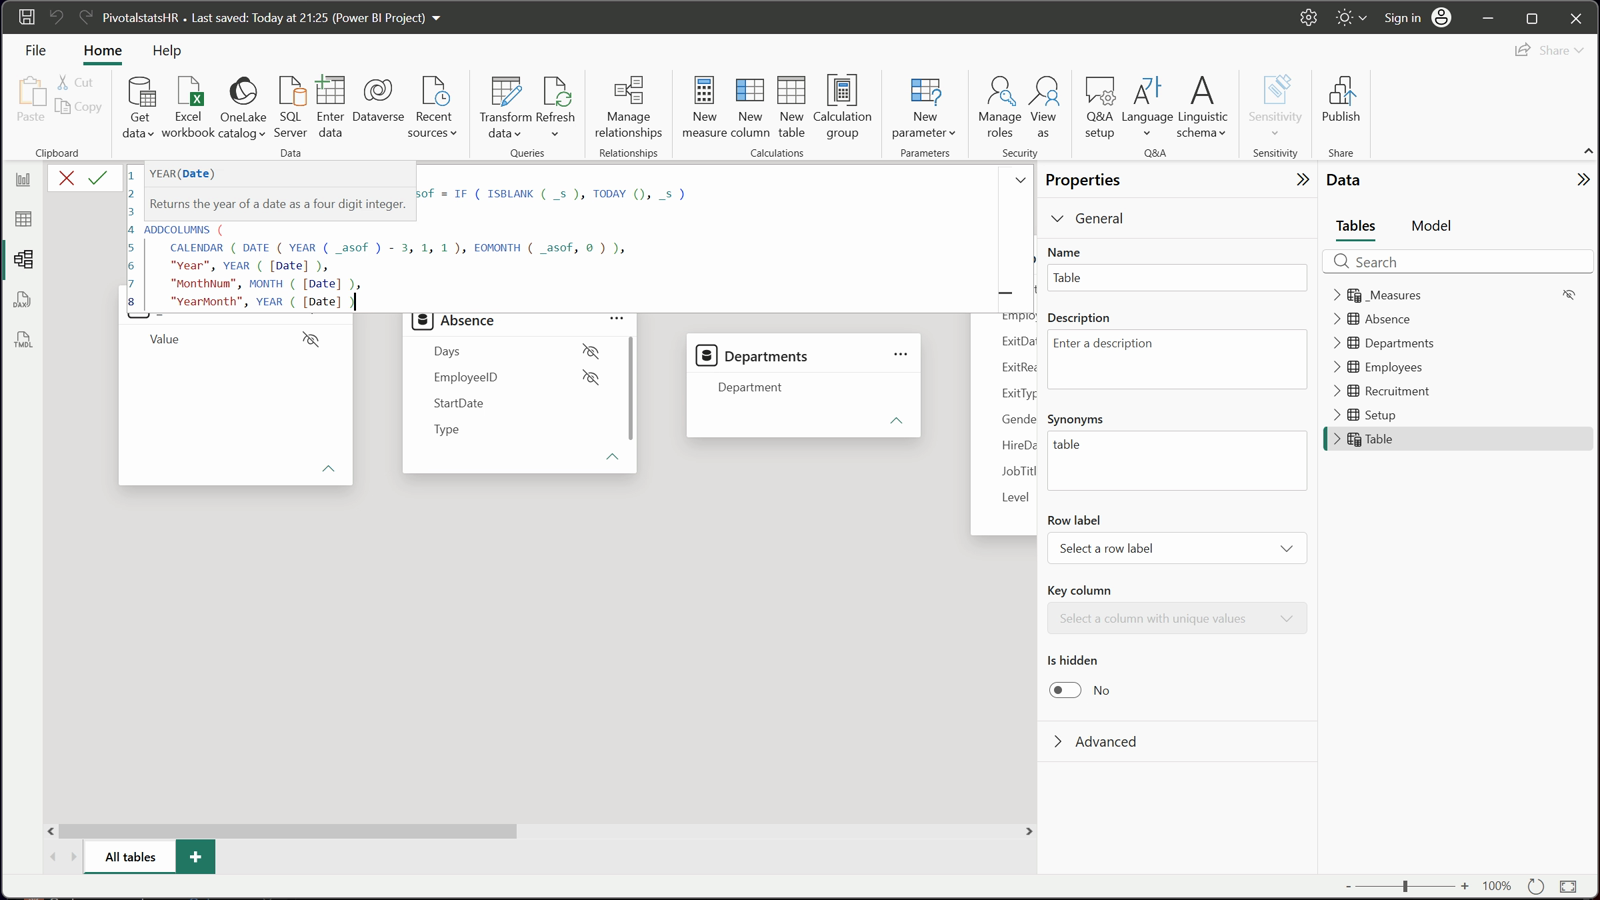
Date table in DAX
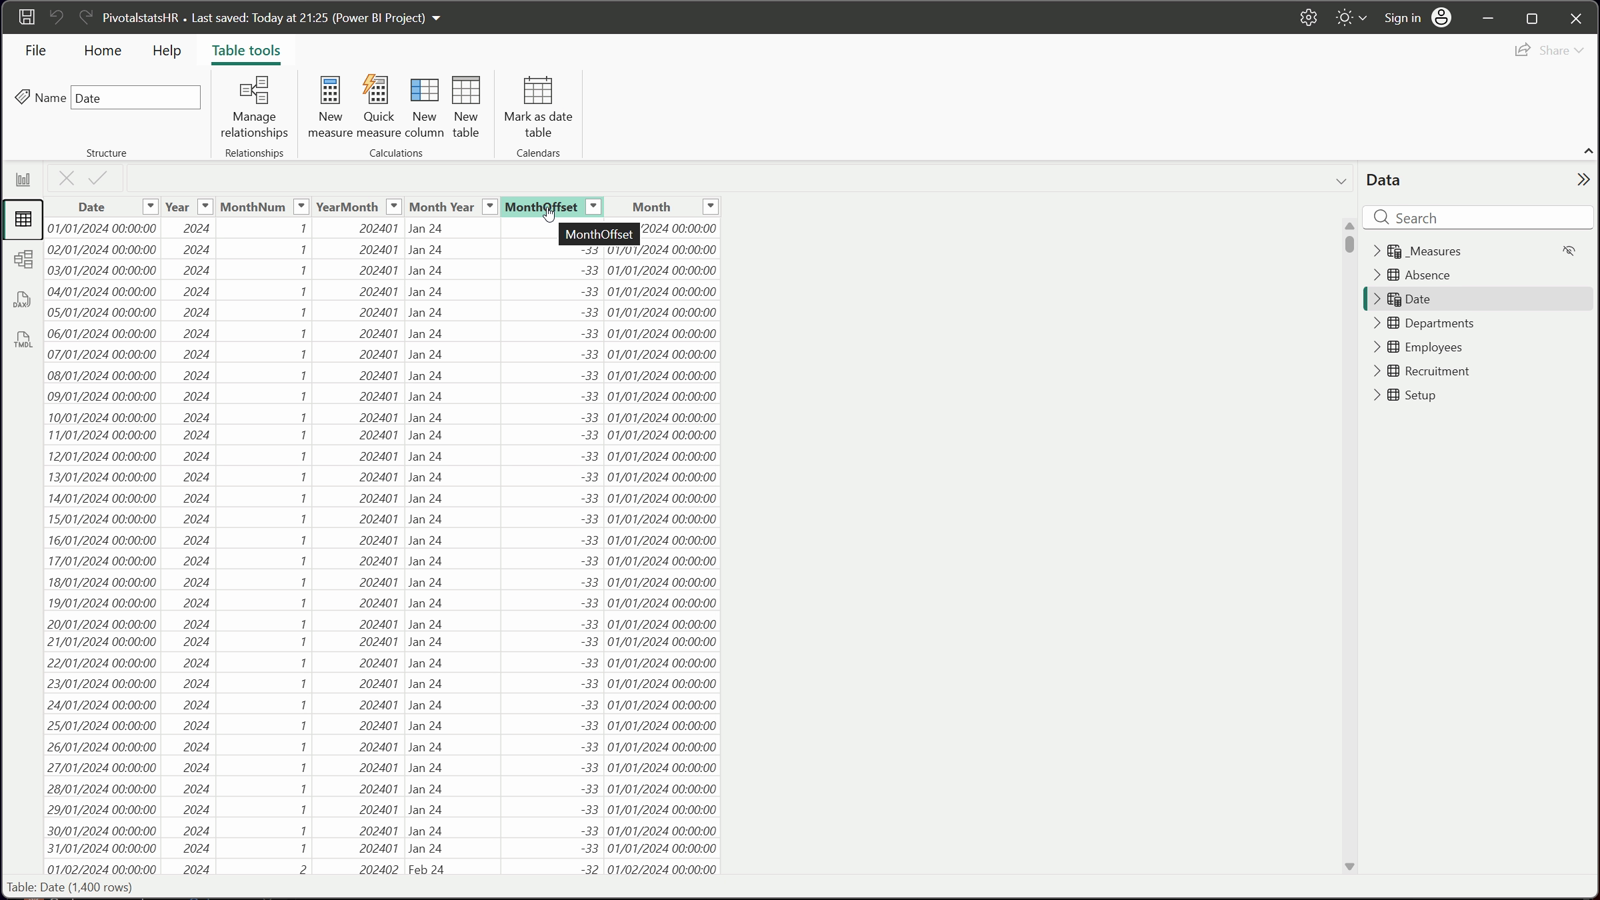
MonthOffset
DAX
Date =

  VAR _s = MAX ( Setup[ReportDate] ) VAR _asof = IF ( ISBLANK ( _s ), TODAY (), _s )

  RETURN

      ADDCOLUMNS (

          CALENDAR ( DATE ( YEAR ( _asof ) - 3, 1, 1 ), EOMONTH ( _asof, 0 ) ),

          "Year", YEAR ( [Date] ),

          "MonthNum", MONTH ( [Date] ),

          "YearMonth", YEAR ( [Date] ) * 100 + MONTH ( [Date] ),

          "Month Year", FORMAT ( [Date], "mmm", "en-US" ) & UNICHAR ( 10 ) & FORMAT ( [Date], "yy", "en-US" ),

          "MonthOffset", ( YEAR ( [Date] ) - YEAR ( _asof ) ) * 12 + MONTH ( [Date] ) - MONTH ( _asof ),

          "Month", DATE ( YEAR ( [Date] ), MONTH ( [Date] ), 1 )

)
Step 07: Headcount on any date, hires and leavers
Period End is the last date in the current filter, capped at the report date: the month end on a monthly chart, the report date on a card. Headcount counts everyone hired on or before Period End who has not left by then. It is a snapshot, so it never adds up across months.
Hires and Leavers count rows with USERELATIONSHIP on the hire date or the exit date. Hires 12M and Leavers 12M wrap them in DATESINPERIOD for the twelve months up to Period End.
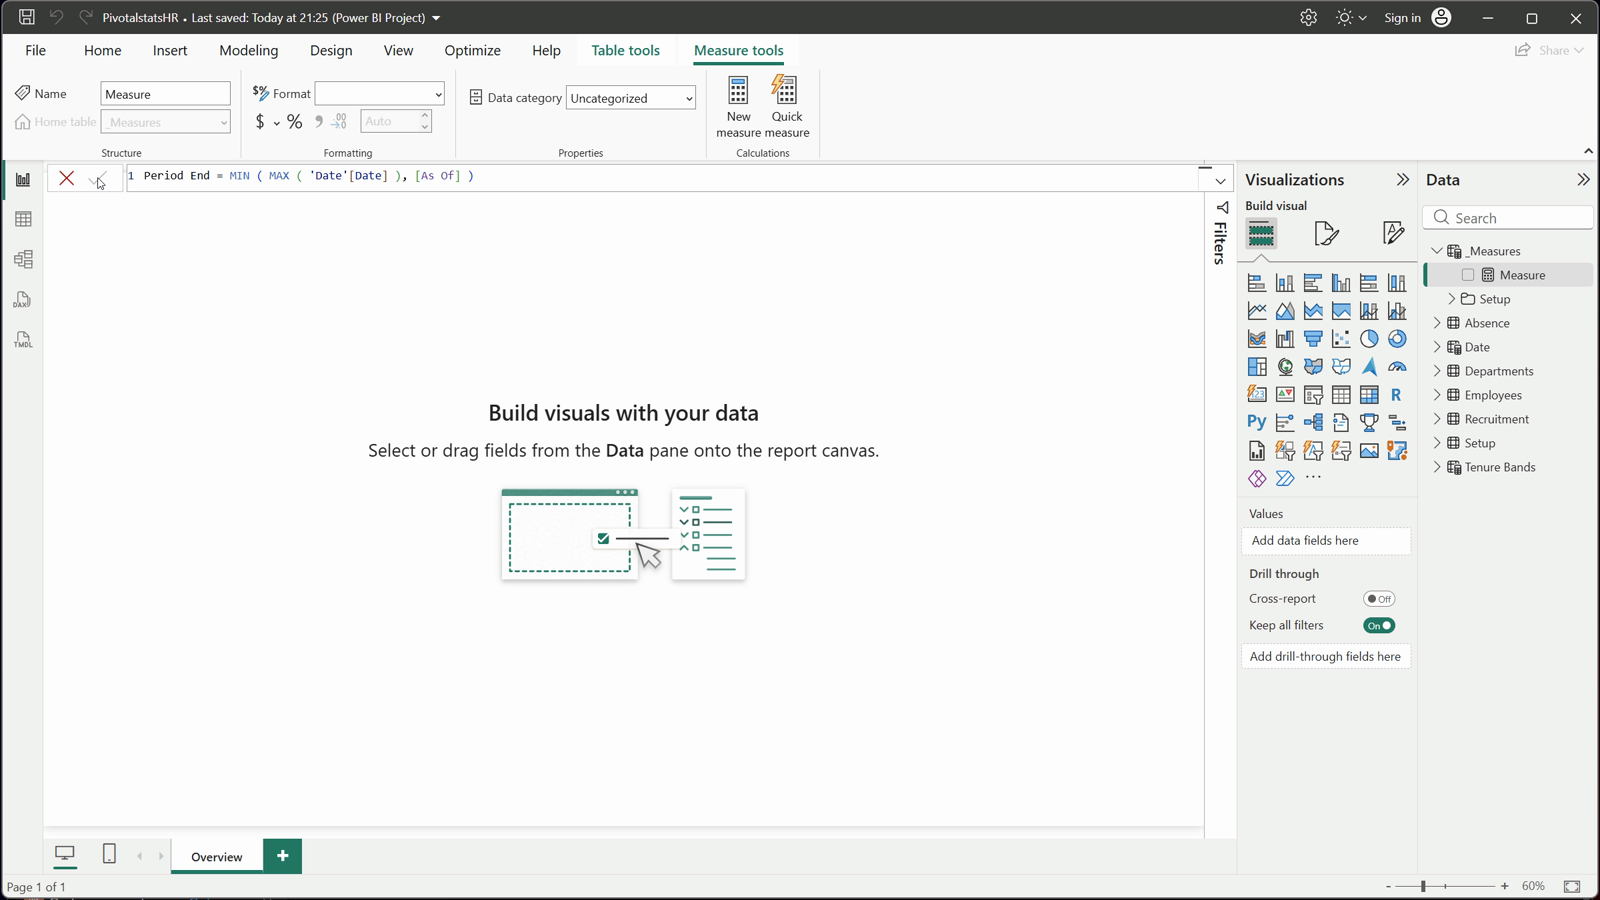
Period End
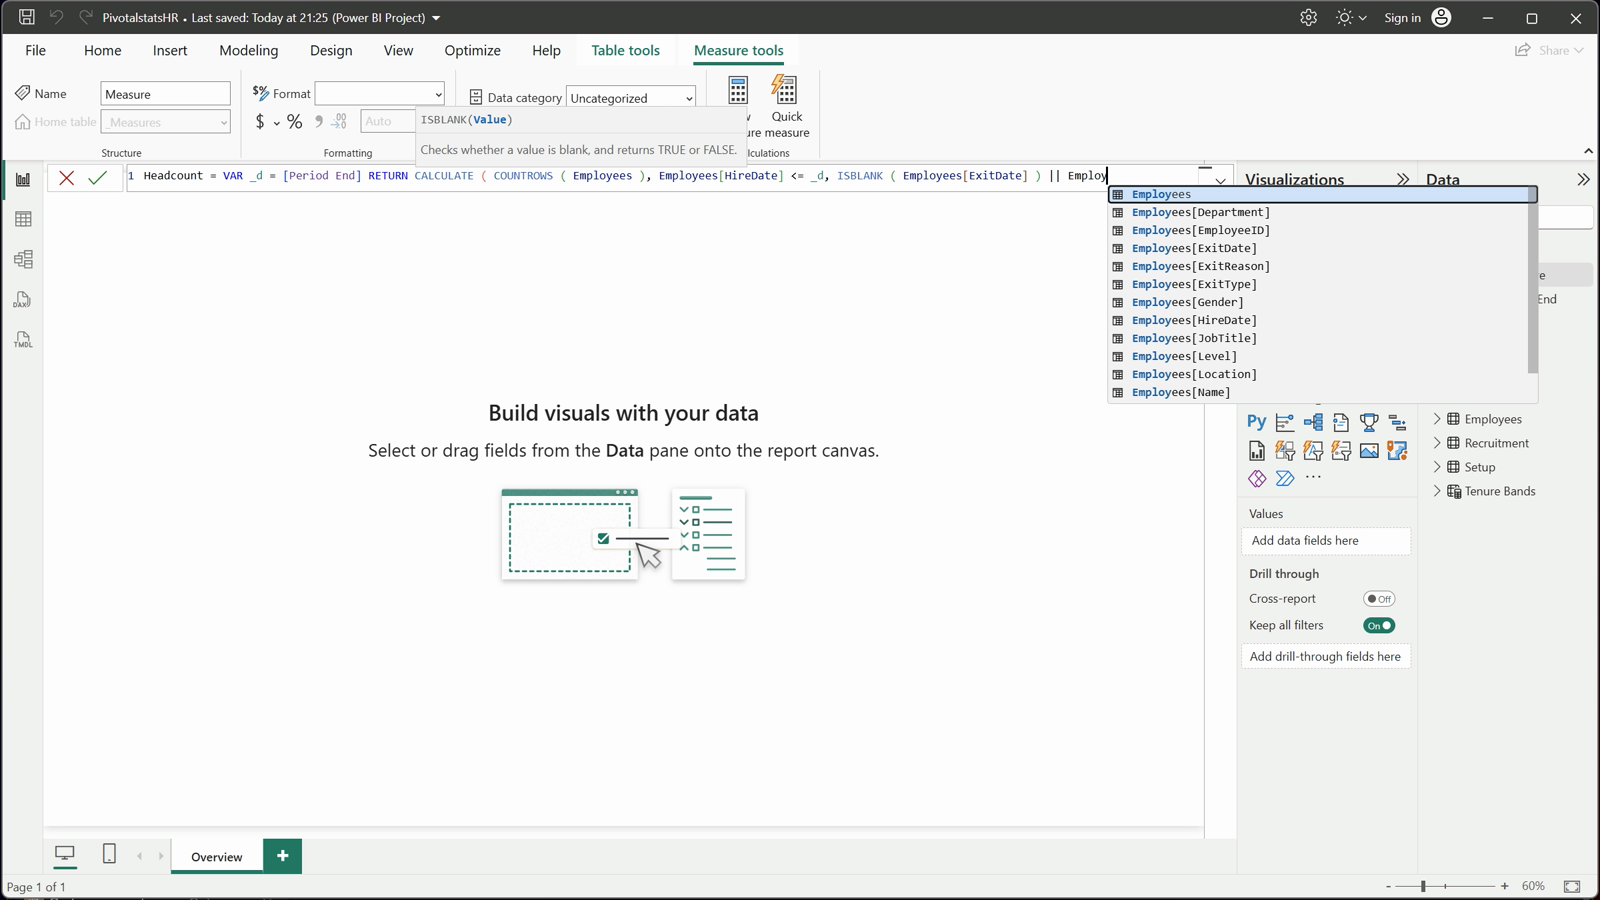
Headcount
DAX
Period End = MIN ( MAX ( 'Date'[Date] ), [As Of] )
DAX
Headcount = VAR _d = [Period End] RETURN CALCULATE ( COUNTROWS ( Employees ), Employees[HireDate] <= _d, ISBLANK ( Employees[ExitDate] ) || Employees[ExitDate] > _d ) + 0
DAX
Hires = CALCULATE ( COUNTROWS ( Employees ), USERELATIONSHIP ( Employees[HireDate], 'Date'[Date] ) ) + 0
DAX
Leavers 12M = CALCULATE ( [Leavers], DATESINPERIOD ( 'Date'[Date], [Period End], -12, MONTH ) )
Step 08: Rolling 12-month turnover
Avg Headcount 12M steps back over the last twelve month ends with GENERATESERIES, takes the headcount at each and averages them. Turnover 12M divides Leavers 12M by that average: 76 / 404.5 = 18.8%.
Turnover 12M Year Ago evaluates the same measure with the date moved back twelve months (14.3%). First Year Leavers 12M keeps the leavers who left less than a year after joining.
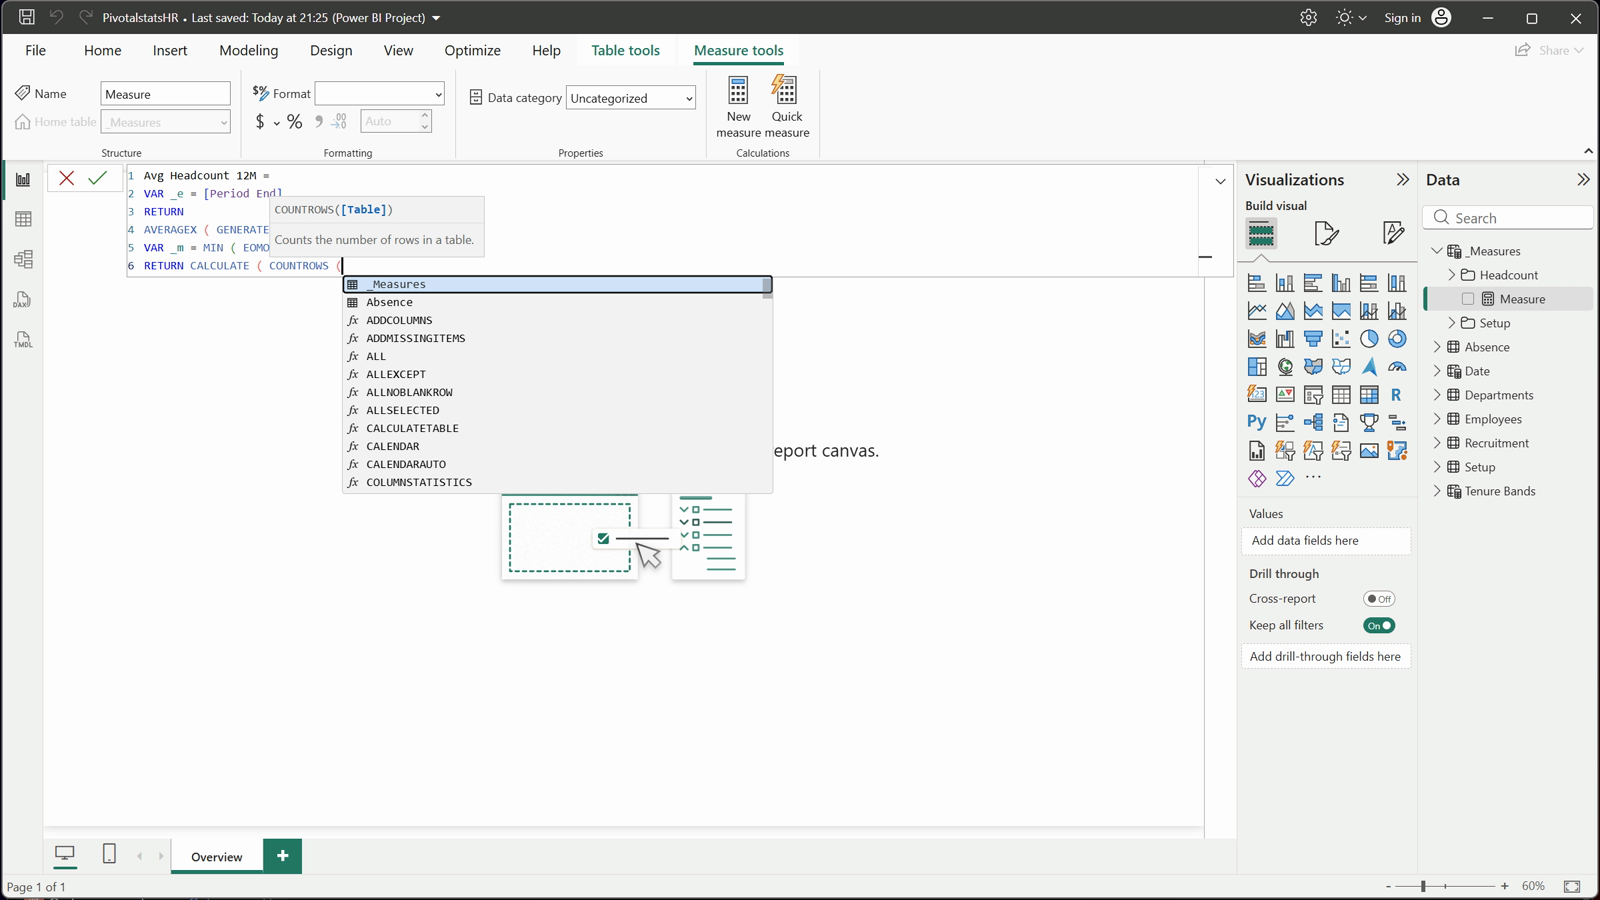
Average of 12 month ends
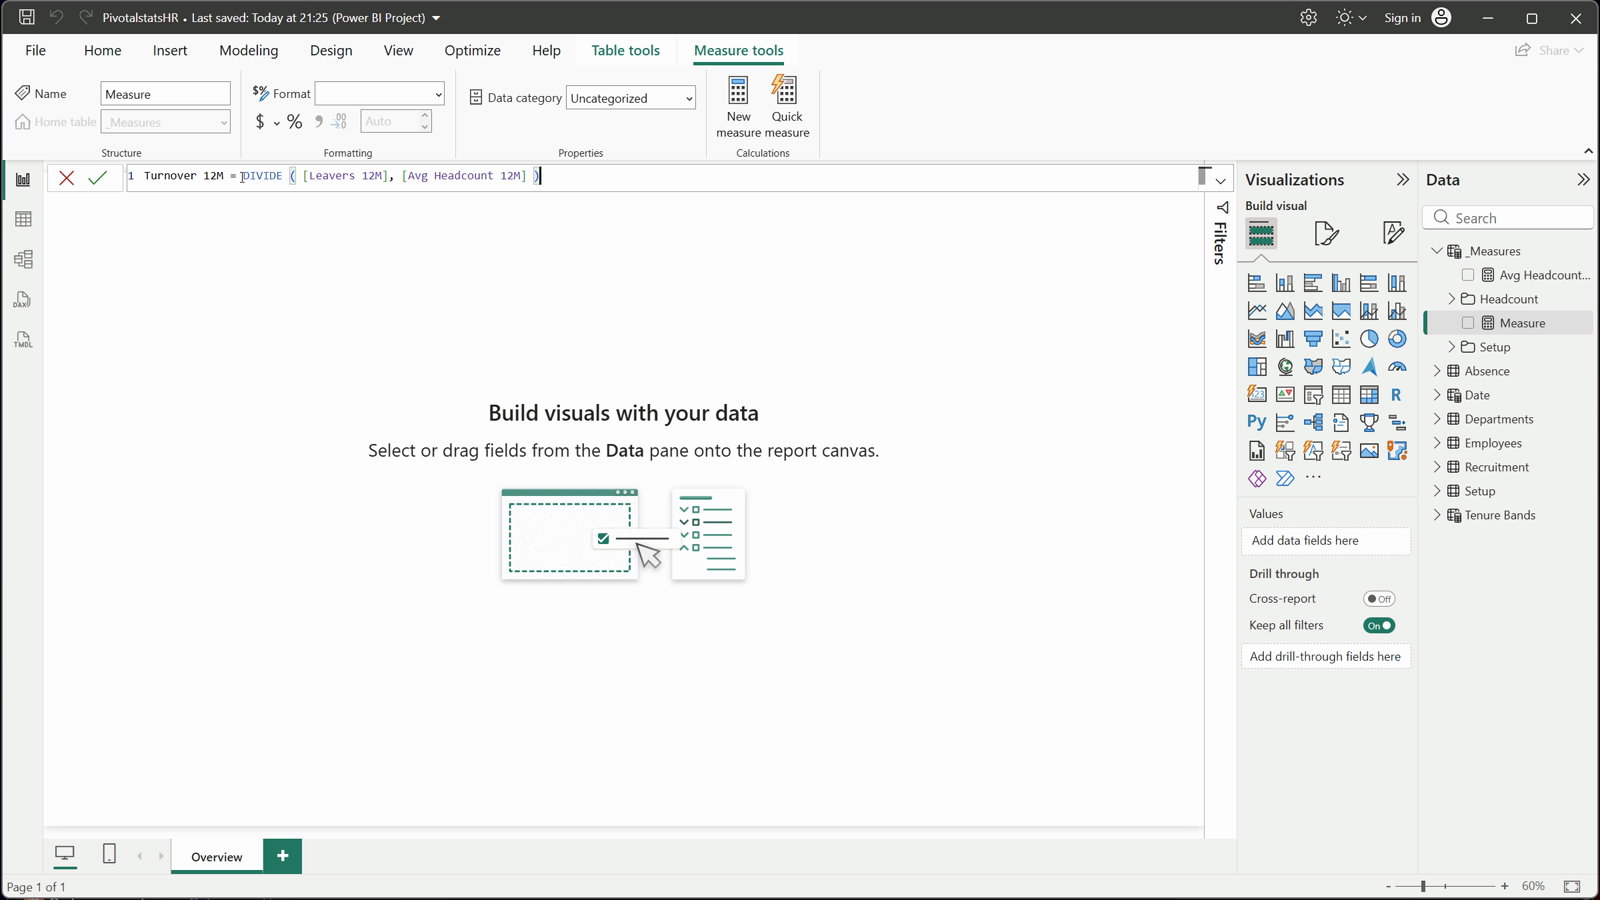
Turnover 12M = 18.8%
DAX
Avg Headcount 12M =

  VAR _e = [Period End]

  RETURN

      AVERAGEX ( GENERATESERIES ( 0, 11 ),

          VAR _m = MIN ( EOMONTH ( _e, - [Value] ), _e )

RETURN CALCULATE ( COUNTROWS ( Employees ), Employees[HireDate] <= _m, ISBLANK ( Employees[ExitDate] ) || Employees[ExitDate] > _m ) + 0 )
DAX
Turnover 12M = DIVIDE ( [Leavers 12M], [Avg Headcount 12M] )
DAX
Turnover 12M Year Ago = VAR _d = EDATE ( [Period End], -12 ) RETURN CALCULATE ( [Turnover 12M], 'Date'[Date] = _d )
DAX
First Year Leavers 12M = CALCULATE ( [Leavers 12M], FILTER ( Employees, NOT ISBLANK ( Employees[ExitDate] ) && DATEDIFF ( Employees[HireDate], Employees[ExitDate], DAY ) / 365.25 < 1 ) )
Step 09: App-style design
The app window, the hero band, the white cards and the illustration are one 1920 x 1080 background image per page, set under Format page > Canvas background with Fit and 0% transparency. A theme file sets the fonts and colours and removes visual backgrounds and borders.
Everything a buyer might change is a real object on top: the logo is an image visual, the brand name a text box, the tabs are buttons with a page navigation action, and the Department slicer is synced across the pages. The background carries no names or logos.
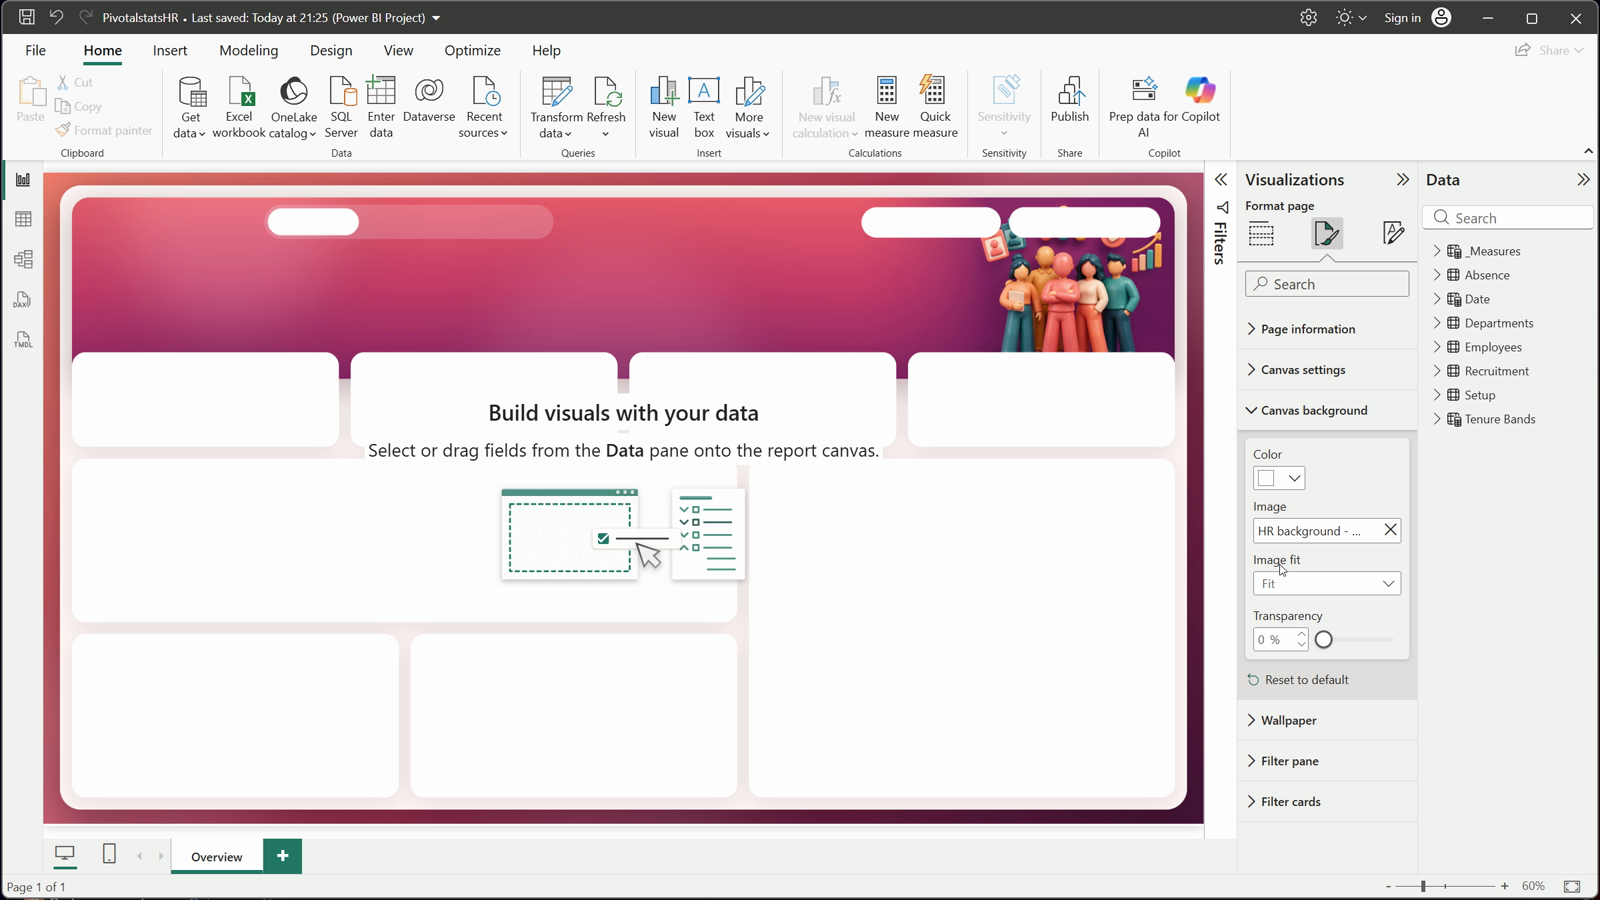
Canvas background
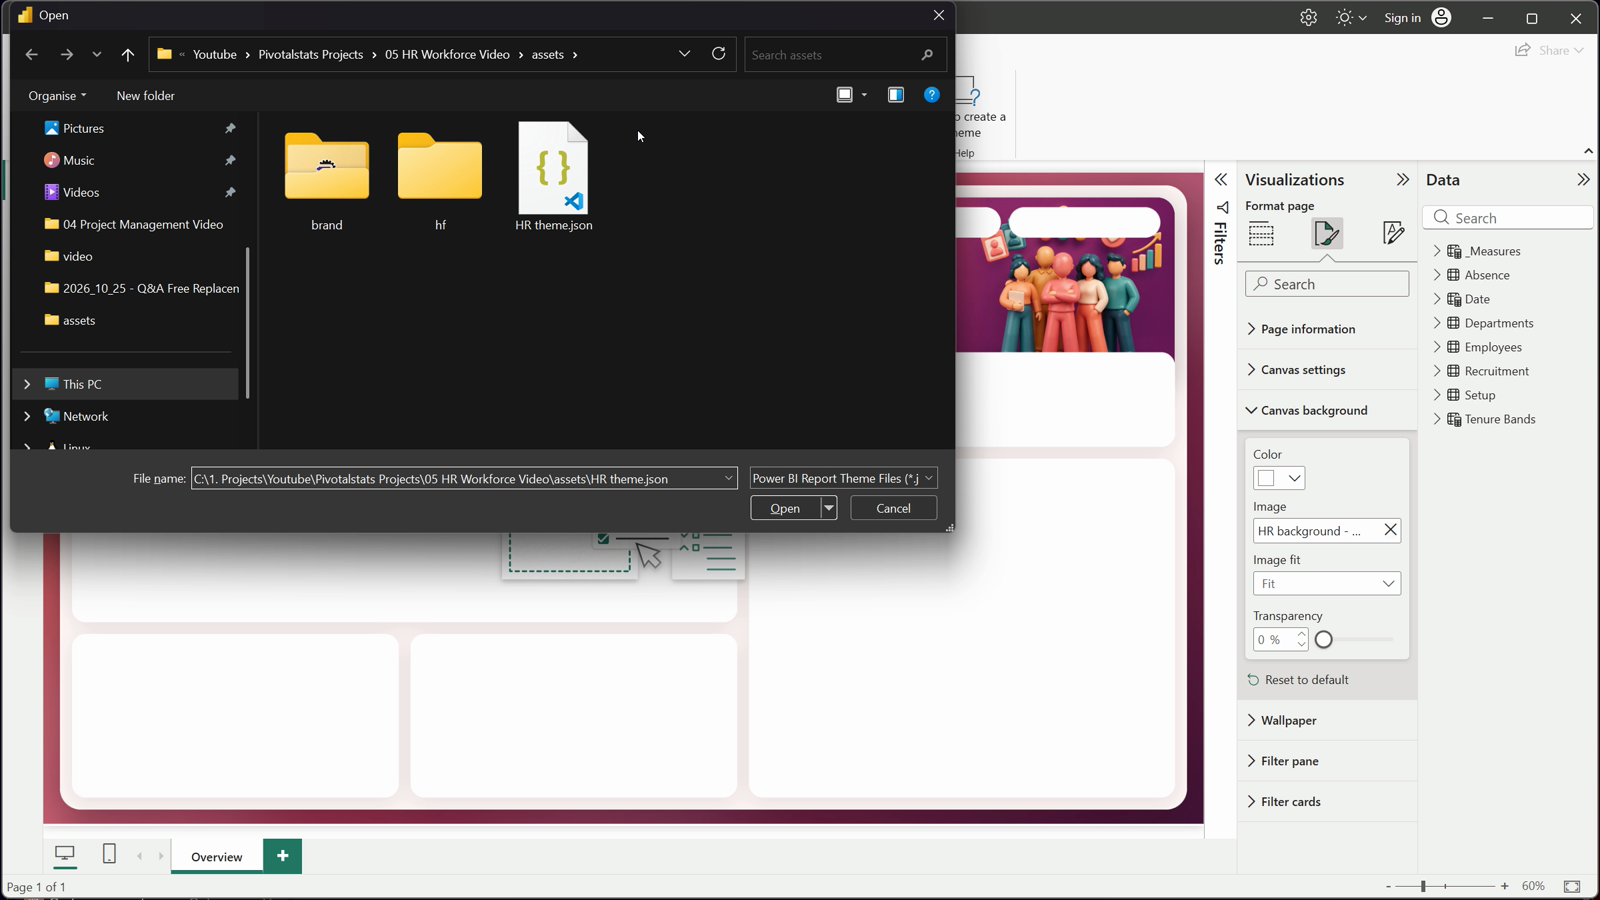
Theme file
Step 10: Cards drawn by DAX
Each KPI card is one DAX measure that returns an SVG picture as text: a label, the value and a coloured pill. Set the measure’s data category to Image URL and show it in an image visual; it reacts to filters like any other measure.
The mini chart is a loop: GENERATESERIES ( 0, 11 ) gives one row per month, CALCULATE evaluates the measure at each month end, and CONCATENATEX draws twelve bars scaled to the highest, with the current month in full colour. The 3D icon is a separate image visual.
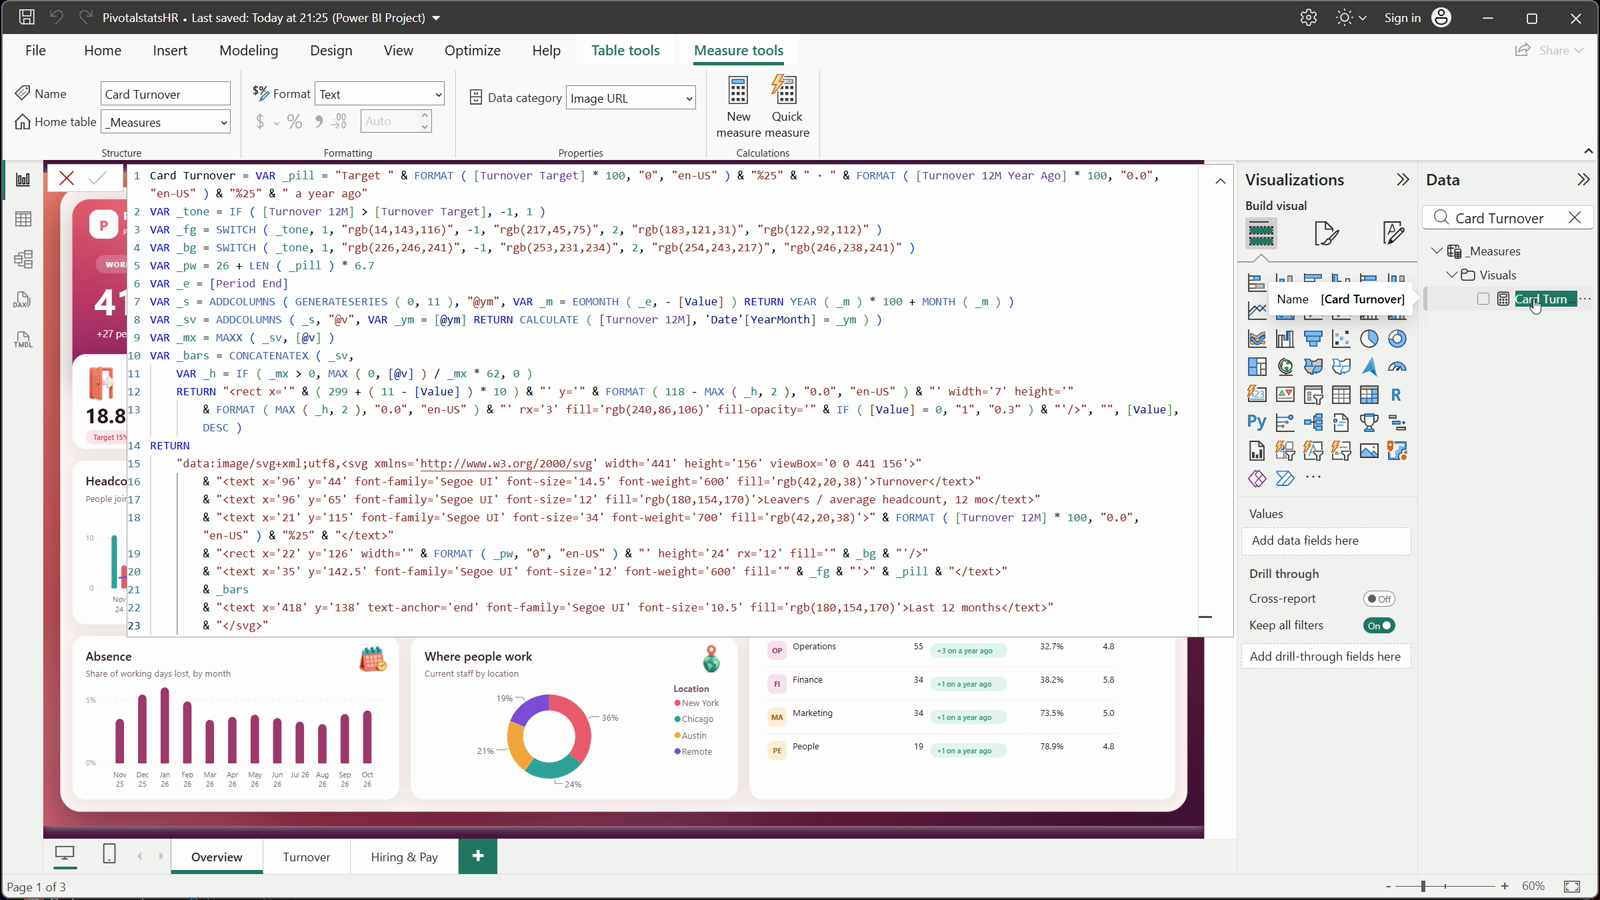
One measure, one picture
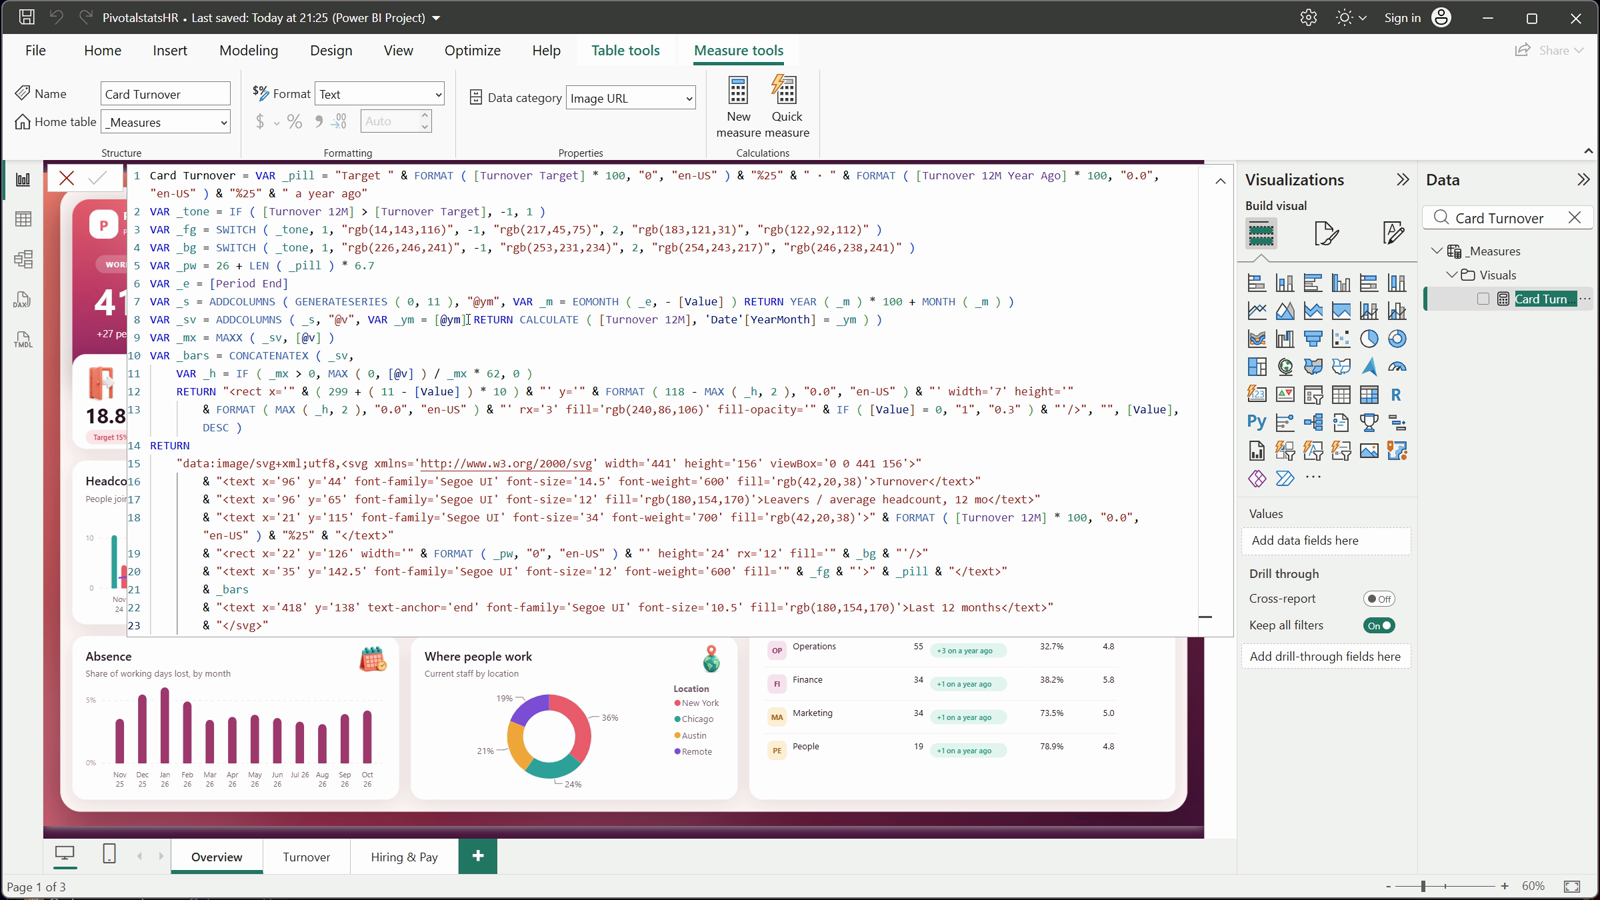
A loop in DAX
DAX
Card Turnover =

  VAR _pill = "Target " & FORMAT ( [Turnover Target] * 100, "0", "en-US" ) & "%25" & " · " & FORMAT ( [Turnover 12M Year Ago] * 100, "0.0", "en-US" ) & "%25" & " a year ago"

  VAR _tone = IF ( [Turnover 12M] > [Turnover Target], -1, 1 )

  VAR _fg = SWITCH ( _tone, 1, "rgb(14,143,116)", -1, "rgb(217,45,75)", 2, "rgb(183,121,31)", "rgb(122,92,112)" )

  VAR _bg = SWITCH ( _tone, 1, "rgb(226,246,241)", -1, "rgb(253,231,234)", 2, "rgb(254,243,217)", "rgb(246,238,241)" )

  VAR _pw = 26 + LEN ( _pill ) * 6.7

  VAR _e = [Period End]

  VAR _s = ADDCOLUMNS ( GENERATESERIES ( 0, 11 ), "@ym", VAR _m = EOMONTH ( _e, - [Value] ) RETURN YEAR ( _m ) * 100 + MONTH ( _m ) )

  VAR _sv = ADDCOLUMNS ( _s, "@v", VAR _ym = [@ym] RETURN CALCULATE ( [Turnover 12M], 'Date'[YearMonth] = _ym ) )

  VAR _mx = MAXX ( _sv, [@v] )

  VAR _bars = CONCATENATEX ( _sv,

      VAR _h = IF ( _mx > 0, MAX ( 0, [@v] ) / _mx * 62, 0 )

      RETURN "<rect x='" & ( 299 + ( 11 - [Value] ) * 10 ) & "' y='" & FORMAT ( 118 - MAX ( _h, 2 ), "0.0", "en-US" ) & "' width='7' height='"

          & FORMAT ( MAX ( _h, 2 ), "0.0", "en-US" ) & "' rx='3' fill='rgb(240,86,106)' fill-opacity='" & IF ( [Value] = 0, "1", "0.3" ) & "'/>", "", [Value], DESC )

  RETURN

      "data:image/svg+xml;utf8,<svg xmlns='http://www.w3.org/2000/svg' width='441' height='156' viewBox='0 0 441 156'>"

          & "<text x='96' y='44' font-family='Segoe UI' font-size='14.5' font-weight='600' fill='rgb(42,20,38)'>Turnover</text>"

          & "<text x='96' y='65' font-family='Segoe UI' font-size='12' fill='rgb(180,154,170)'>Leavers / average headcount, 12 mo</text>"

          & "<text x='21' y='115' font-family='Segoe UI' font-size='34' font-weight='700' fill='rgb(42,20,38)'>" & FORMAT ( [Turnover 12M] * 100, "0.0", "en-US" ) & "%25" & "</text>"

          & "<rect x='22' y='126' width='" & FORMAT ( _pw, "0", "en-US" ) & "' height='24' rx='12' fill='" & _bg & "'/>"

          & "<text x='35' y='142.5' font-family='Segoe UI' font-size='12' font-weight='600' fill='" & _fg & "'>" & _pill & "</text>"

          & _bars

          & "<text x='418' y='138' text-anchor='end' font-family='Segoe UI' font-size='10.5' fill='rgb(180,154,170)'>Last 12 months</text>"

& "</svg>"
Step 11: Rounded columns and the departments table
The headcount chart is a standard line and clustered column chart: Mo Hires and Mo Leavers as columns, Mo Headcount as a line on the secondary axis. The rounded tops are native error bars: the real columns are painted white, and each value is drawn as an error bar from zero with a circle marker, so tooltips still work.
The Departments table uses SVG measures for the chip and the change pill. The pill starts with a hidden sort key (data-k right after the svg tag), so sorting the column sorts by the change.
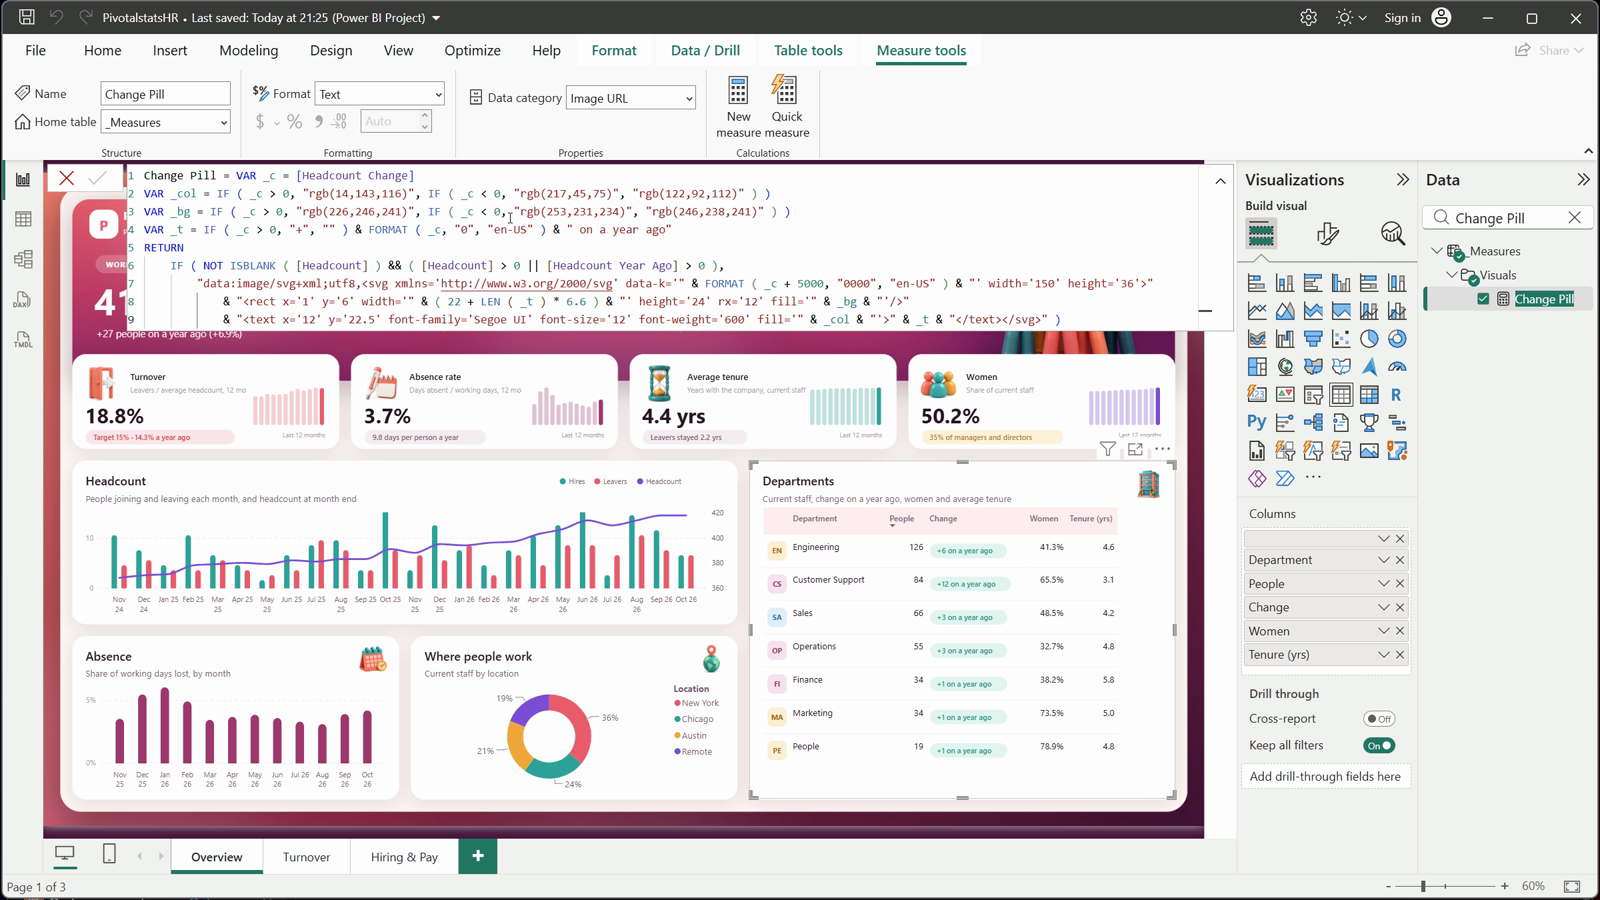
Hidden sort key
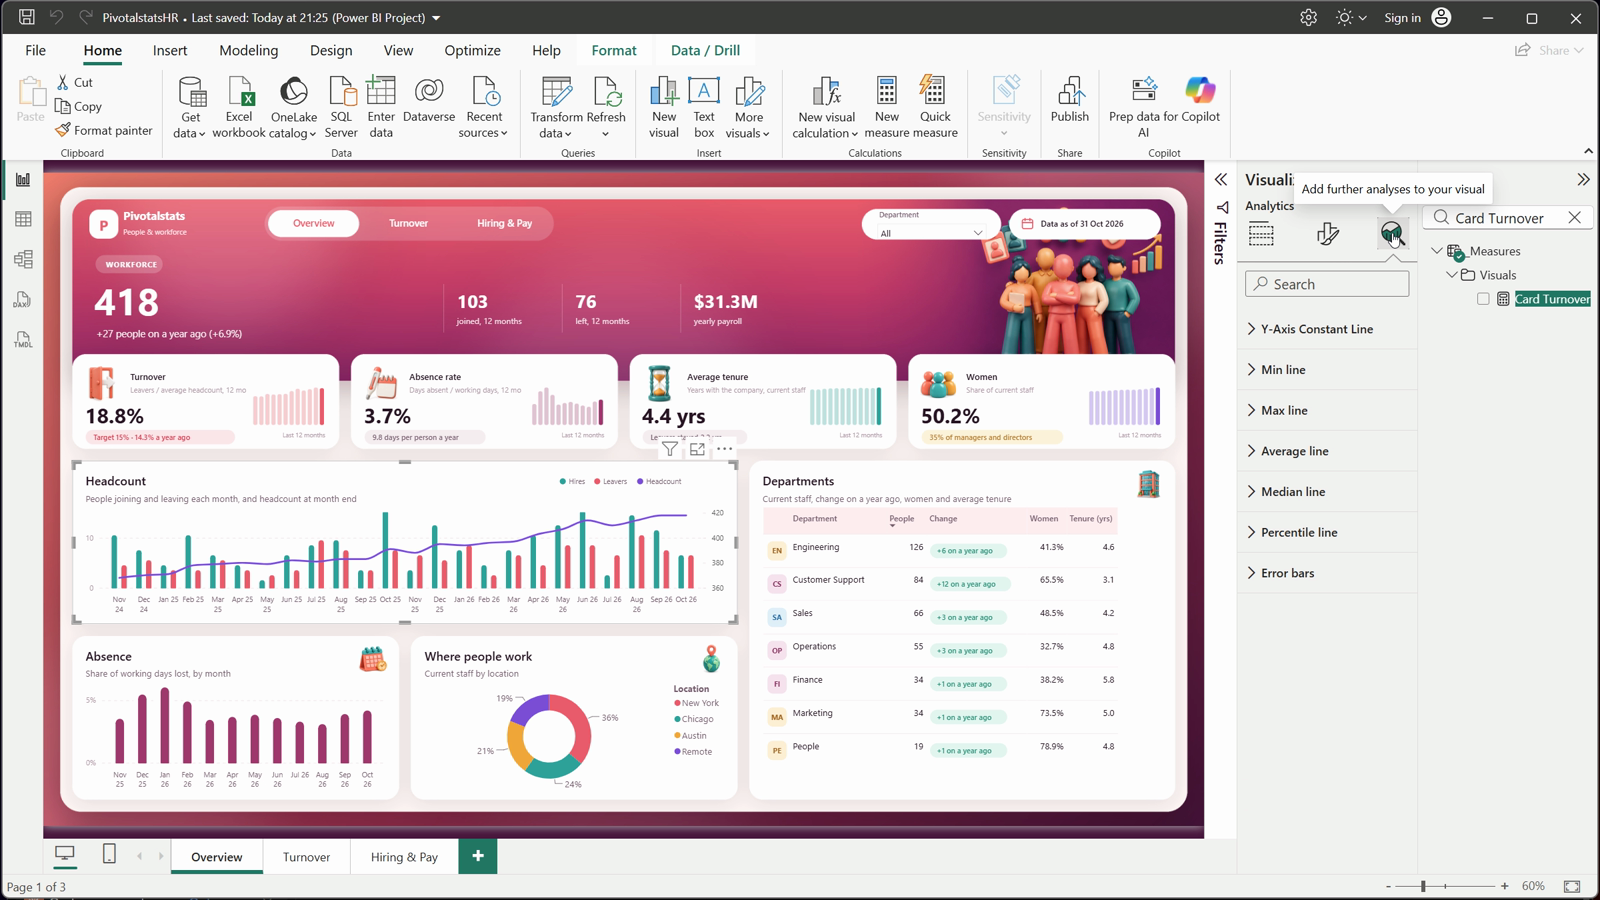
Rounded columns
DAX
Mo Headcount = IF ( HASONEVALUE ( 'Date'[YearMonth] ) && NOT ISBLANK ( MAX ( 'Date'[Date] ) ) && MAX ( 'Date'[MonthOffset] ) >= -23, [Headcount] )
DAX
Change Pill =

  VAR _c = [Headcount Change]

  VAR _col = IF ( _c > 0, "rgb(14,143,116)", IF ( _c < 0, "rgb(217,45,75)", "rgb(122,92,112)" ) )

  VAR _bg = IF ( _c > 0, "rgb(226,246,241)", IF ( _c < 0, "rgb(253,231,234)", "rgb(246,238,241)" ) )

  VAR _t = IF ( _c > 0, "+", "" ) & FORMAT ( _c, "0", "en-US" ) & " on a year ago"

  RETURN

      IF ( NOT ISBLANK ( [Headcount] ) && ( [Headcount] > 0 || [Headcount Year Ago] > 0 ),

          "data:image/svg+xml;utf8,<svg xmlns='http://www.w3.org/2000/svg' data-k='" & FORMAT ( _c + 5000, "0000", "en-US" ) & "' width='150' height='36'>"

              & "<rect x='1' y='6' width='" & ( 22 + LEN ( _t ) * 6.6 ) & "' height='24' rx='12' fill='" & _bg & "'/>"

& "<text x='12' y='22.5' font-family='Segoe UI' font-size='12' font-weight='600' fill='" & _col & "'>" & _t & "</text></svg>" )
Step 12: Turnover by department, reason and tenure
The trend plots Turnover 12M at each month end against the target. Turnover by department is an SVG bar with a black tick at the target that turns red above it. Why people leave is a stacked bar of voluntary and involuntary leavers by exit reason.
How long leavers stayed uses a small DAX table (DATATABLE) with four tenure bands; Band Leavers 12M counts the leavers whose tenure falls inside each band. The recent leavers table shows the newest first, with a heart for regretted leavers.
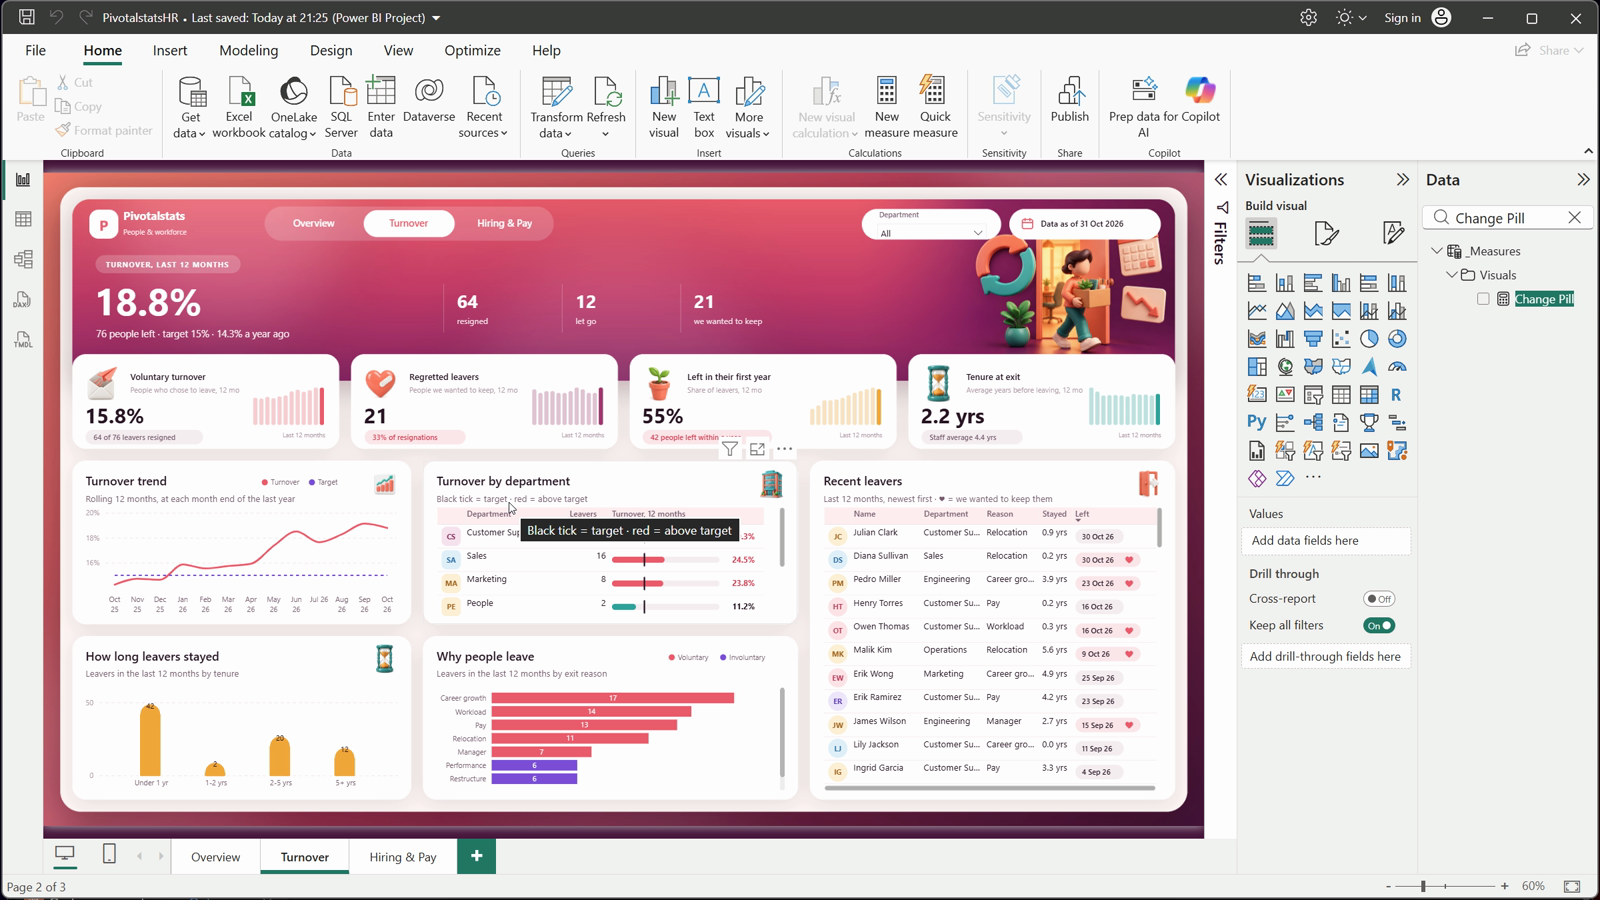
Black tick = target
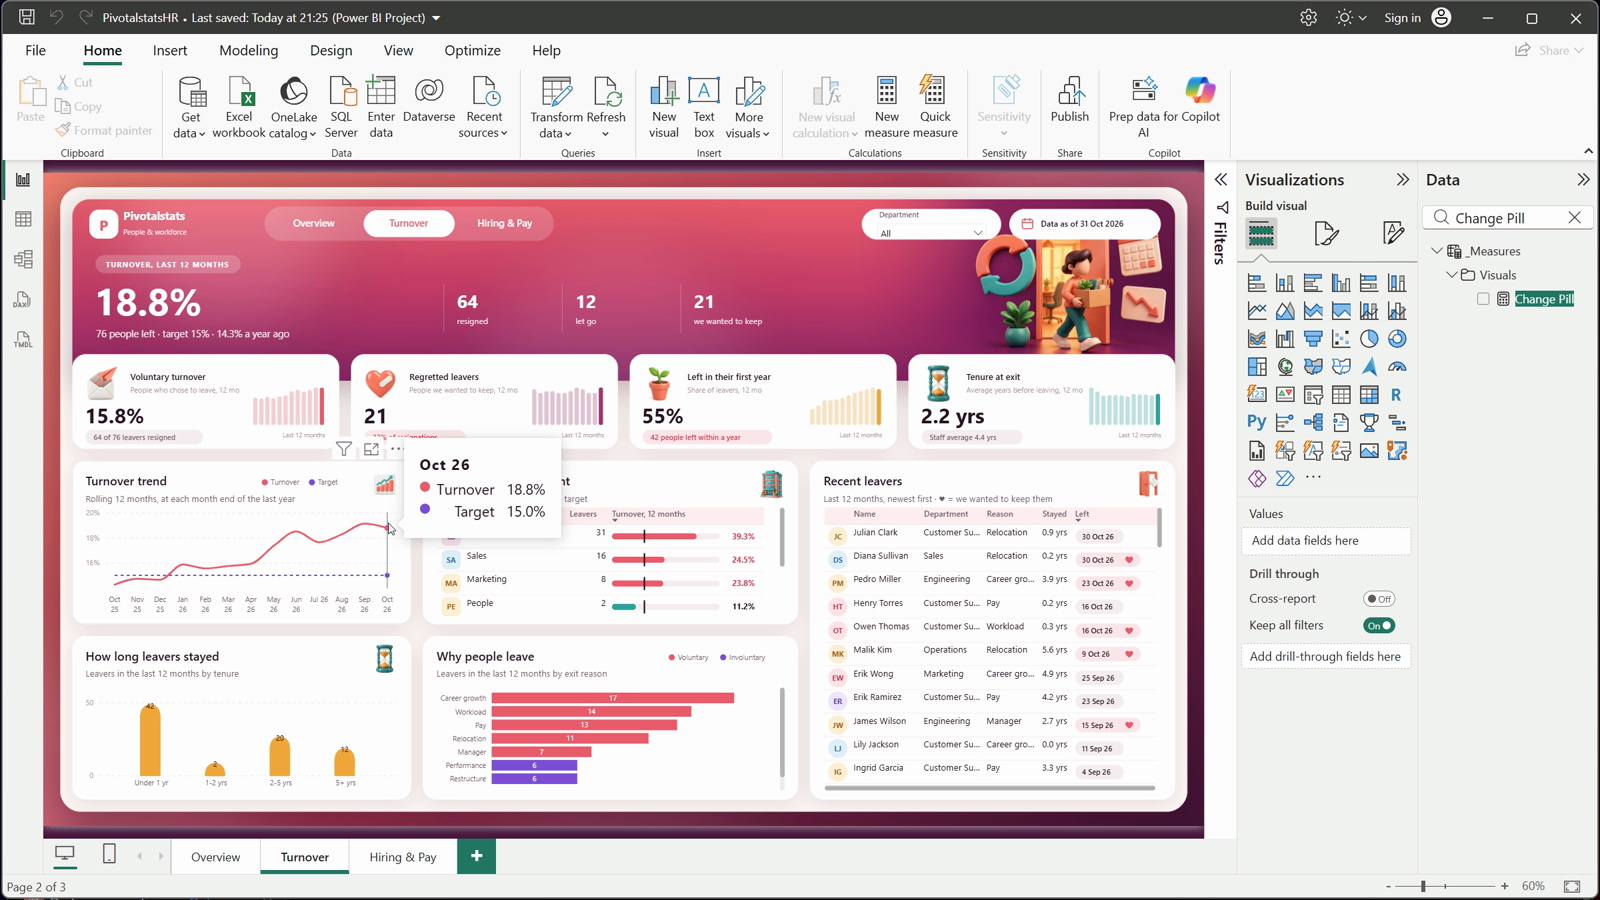
Rolling 12-month turnover
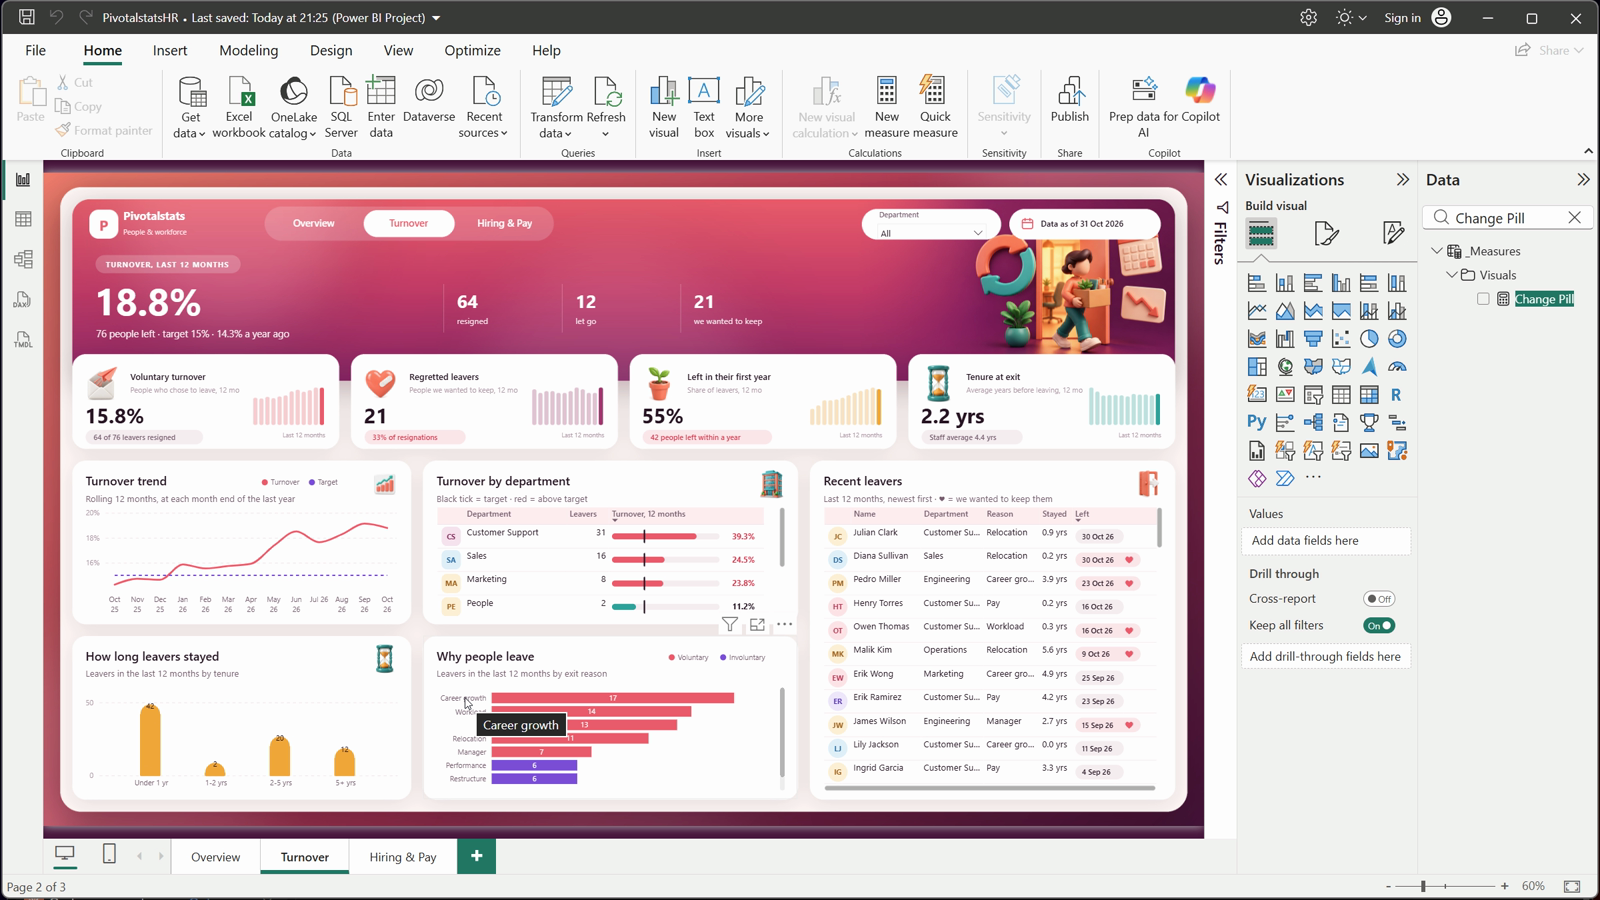
Why people leave
DAX
Tenure Bands =

  DATATABLE (

      "Band", STRING, "Sort", INTEGER, "From", DOUBLE, "To", DOUBLE,

      { { "Under 1 yr", 1, 0, 1 }, { "1-2 yrs", 2, 1, 2 }, { "2-5 yrs", 3, 2, 5 }, { "5+ yrs", 4, 5, 100 } }

)
DAX
Band Leavers 12M =

  VAR _f = MIN ( 'Tenure Bands'[From] )

  VAR _t = MAX ( 'Tenure Bands'[To] )

  RETURN

      CALCULATE ( [Leavers 12M],

          FILTER ( Employees,

              NOT ISBLANK ( Employees[ExitDate] )

                  && DATEDIFF ( Employees[HireDate], Employees[ExitDate], DAY ) / 365.25 >= _f

&& DATEDIFF ( Employees[HireDate], Employees[ExitDate], DAY ) / 365.25 < _t ) )
DAX
Turnover Bar =

  VAR _t = [Turnover 12M] + 0

  VAR _g = [Turnover Target]

  VAR _c = IF ( _t > _g, "rgb(240,86,106)", "rgb(20,163,154)" )

  VAR _w = 178

  VAR _sc = 0.5

  RETURN

      IF ( [Avg Headcount 12M] > 0,

          "data:image/svg+xml;utf8,<svg xmlns='http://www.w3.org/2000/svg' data-k='" & FORMAT ( _t * 1000, "0000", "en-US" ) & "' width='240' height='36'>"

              & "<rect x='0' y='13' width='" & _w & "' height='10' rx='5' fill='rgb(246,238,241)'/>"

              & "<rect x='0' y='13' width='" & FORMAT ( MIN ( 1, _t / _sc ) * _w, "0.0", "en-US" ) & "' height='10' rx='5' fill='" & _c & "'/>"

              & "<rect x='" & FORMAT ( MIN ( 1, _g / _sc ) * _w - 1, "0.0", "en-US" ) & "' y='7' width='2.5' height='22' rx='1.2' fill='rgb(42,20,38)'/>"

              & "<text x='236' y='22.5' text-anchor='end' font-family='Segoe UI' font-size='13' font-weight='700' fill='" & IF ( _t > _g, "rgb(217,45,75)", "rgb(42,20,38)" ) & "'>"

& FORMAT ( _t * 100, "0.0", "en-US" ) & "%25</text></svg>" )
Step 13: Hiring funnel, time to fill and pay by level
The hiring funnel is one SVG measure over the roles opened in the last twelve months: applicants, screened, interviewed, offers and hired. Bar widths use the square root of each count so the small steps stay visible, and each step shows its conversion from the step before.
Time To Fill 12M averages the days from opening a role to an accepted offer. The pay table compares the median pay of women and men at each level with a dumbbell; Pay Gap = 1 – women’s median / men’s median.
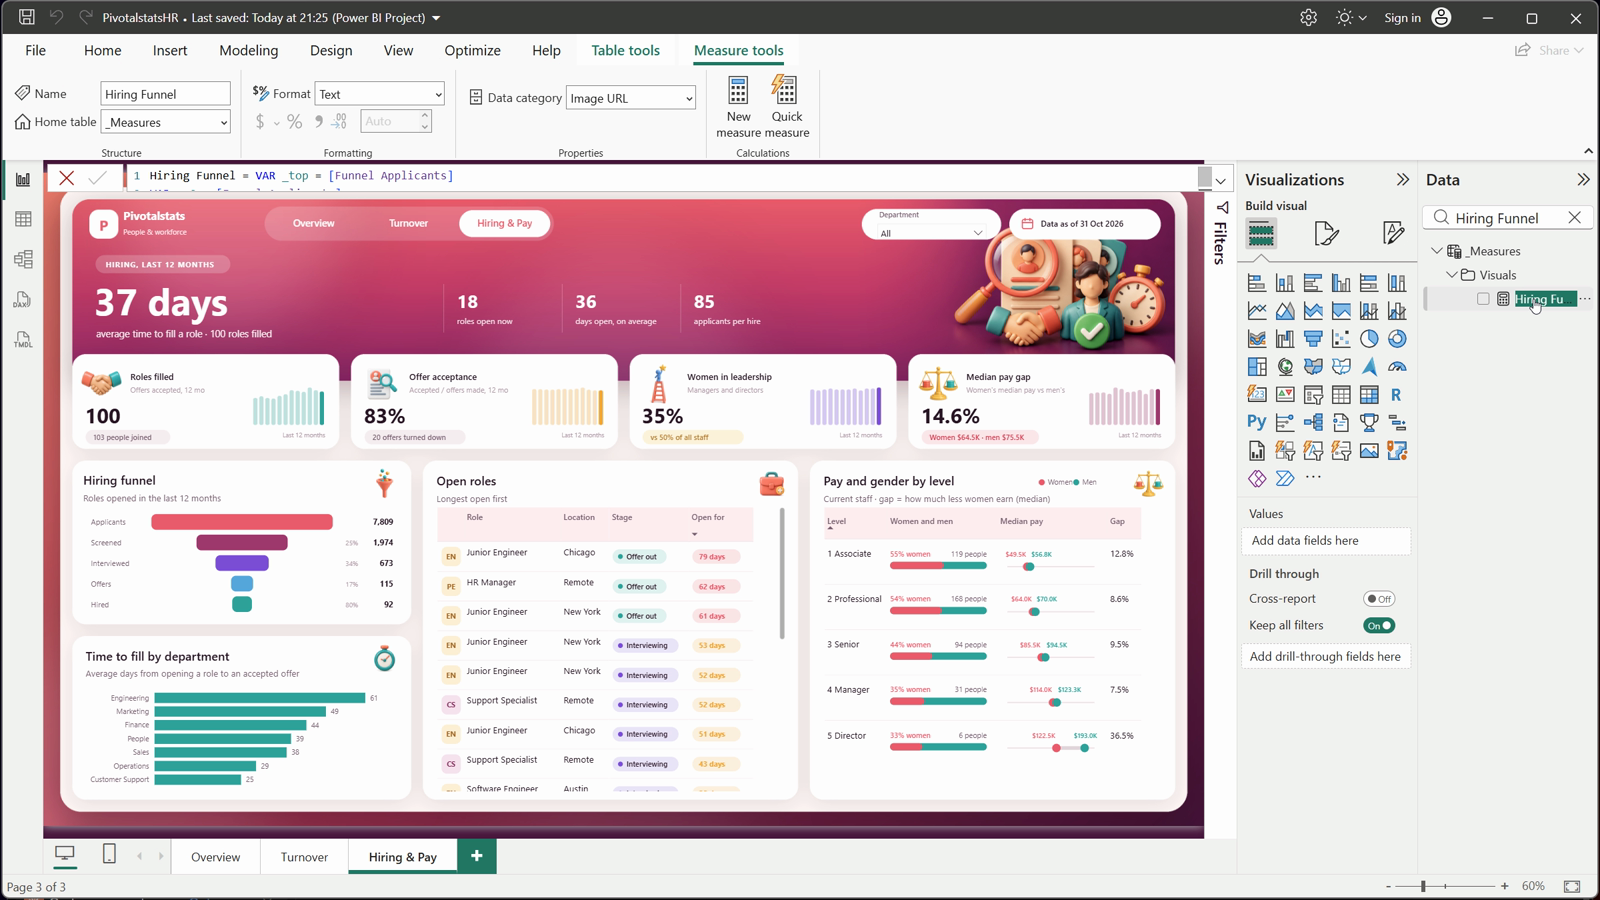
Hiring funnel
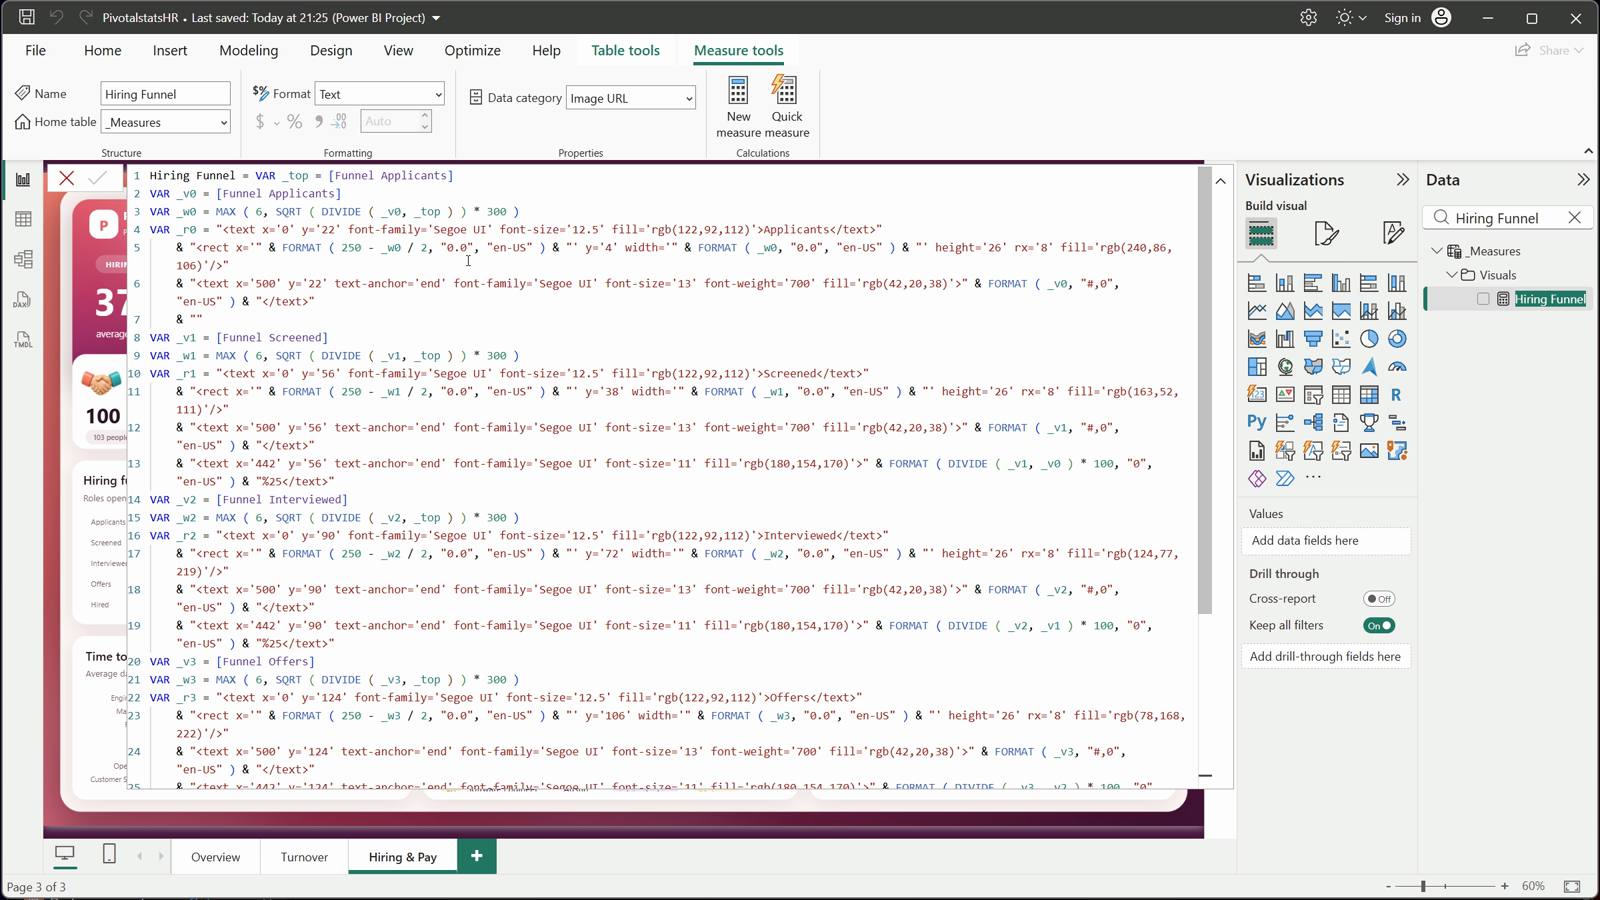
SQRT widths
DAX
Hiring Funnel =

  VAR _top = [Funnel Applicants]

  VAR _v0 = [Funnel Applicants]

  VAR _w0 = MAX ( 6, SQRT ( DIVIDE ( _v0, _top ) ) * 300 )

  VAR _r0 = "<text x='0' y='22' font-family='Segoe UI' font-size='12.5' fill='rgb(122,92,112)'>Applicants</text>"

      & "<rect x='" & FORMAT ( 250 - _w0 / 2, "0.0", "en-US" ) & "' y='4' width='" & FORMAT ( _w0, "0.0", "en-US" ) & "' height='26' rx='8' fill='rgb(240,86,106)'/>"

      & "<text x='500' y='22' text-anchor='end' font-family='Segoe UI' font-size='13' font-weight='700' fill='rgb(42,20,38)'>" & FORMAT ( _v0, "#,0", "en-US" ) & "</text>"

      & ""

  VAR _v1 = [Funnel Screened]

  VAR _w1 = MAX ( 6, SQRT ( DIVIDE ( _v1, _top ) ) * 300 )

  VAR _r1 = "<text x='0' y='56' font-family='Segoe UI' font-size='12.5' fill='rgb(122,92,112)'>Screened</text>"

      & "<rect x='" & FORMAT ( 250 - _w1 / 2, "0.0", "en-US" ) & "' y='38' width='" & FORMAT ( _w1, "0.0", "en-US" ) & "' height='26' rx='8' fill='rgb(163,52,111)'/>"

      & "<text x='500' y='56' text-anchor='end' font-family='Segoe UI' font-size='13' font-weight='700' fill='rgb(42,20,38)'>" & FORMAT ( _v1, "#,0", "en-US" ) & "</text>"

      & "<text x='442' y='56' text-anchor='end' font-family='Segoe UI' font-size='11' fill='rgb(180,154,170)'>" & FORMAT ( DIVIDE ( _v1, _v0 ) * 100, "0", "en-US" ) & "%25</text>"

  VAR _v2 = [Funnel Interviewed]

  VAR _w2 = MAX ( 6, SQRT ( DIVIDE ( _v2, _top ) ) * 300 )

  VAR _r2 = "<text x='0' y='90' font-family='Segoe UI' font-size='12.5' fill='rgb(122,92,112)'>Interviewed</text>"

      & "<rect x='" & FORMAT ( 250 - _w2 / 2, "0.0", "en-US" ) & "' y='72' width='" & FORMAT ( _w2, "0.0", "en-US" ) & "' height='26' rx='8' fill='rgb(124,77,219)'/>"

      & "<text x='500' y='90' text-anchor='end' font-family='Segoe UI' font-size='13' font-weight='700' fill='rgb(42,20,38)'>" & FORMAT ( _v2, "#,0", "en-US" ) & "</text>"

      & "<text x='442' y='90' text-anchor='end' font-family='Segoe UI' font-size='11' fill='rgb(180,154,170)'>" & FORMAT ( DIVIDE ( _v2, _v1 ) * 100, "0", "en-US" ) & "%25</text>"

  VAR _v3 = [Funnel Offers]

  VAR _w3 = MAX ( 6, SQRT ( DIVIDE ( _v3, _top ) ) * 300 )

  VAR _r3 = "<text x='0' y='124' font-family='Segoe UI' font-size='12.5' fill='rgb(122,92,112)'>Offers</text>"

      & "<rect x='" & FORMAT ( 250 - _w3 / 2, "0.0", "en-US" ) & "' y='106' width='" & FORMAT ( _w3, "0.0", "en-US" ) & "' height='26' rx='8' fill='rgb(78,168,222)'/>"

      & "<text x='500' y='124' text-anchor='end' font-family='Segoe UI' font-size='13' font-weight='700' fill='rgb(42,20,38)'>" & FORMAT ( _v3, "#,0", "en-US" ) & "</text>"

      & "<text x='442' y='124' text-anchor='end' font-family='Segoe UI' font-size='11' fill='rgb(180,154,170)'>" & FORMAT ( DIVIDE ( _v3, _v2 ) * 100, "0", "en-US" ) & "%25</text>"

  VAR _v4 = [Funnel Hired]

  VAR _w4 = MAX ( 6, SQRT ( DIVIDE ( _v4, _top ) ) * 300 )

  VAR _r4 = "<text x='0' y='158' font-family='Segoe UI' font-size='12.5' fill='rgb(122,92,112)'>Hired</text>"

      & "<rect x='" & FORMAT ( 250 - _w4 / 2, "0.0", "en-US" ) & "' y='140' width='" & FORMAT ( _w4, "0.0", "en-US" ) & "' height='26' rx='8' fill='rgb(20,163,154)'/>"

      & "<text x='500' y='158' text-anchor='end' font-family='Segoe UI' font-size='13' font-weight='700' fill='rgb(42,20,38)'>" & FORMAT ( _v4, "#,0", "en-US" ) & "</text>"

      & "<text x='442' y='158' text-anchor='end' font-family='Segoe UI' font-size='11' fill='rgb(180,154,170)'>" & FORMAT ( DIVIDE ( _v4, _v3 ) * 100, "0", "en-US" ) & "%25</text>"

  RETURN

IF ( _top > 0, "data:image/svg+xml;utf8,<svg xmlns='http://www.w3.org/2000/svg' width='500' height='176' viewBox='0 0 500 176'>" & _r0 & _r1 & _r2 & _r3 & _r4 & "</svg>" )
DAX
Time To Fill 12M = VAR _e = [Period End] RETURN AVERAGEX ( FILTER ( Recruitment, Recruitment[Status] = "Filled" && NOT ISBLANK ( Recruitment[Closed] ) && Recruitment[Closed] > EDATE ( _e, -12 ) && Recruitment[Closed] <= _e ), DATEDIFF ( Recruitment[Opened], Recruitment[Closed], DAY ) )
DAX
Pay Gap = VAR _w = [Median Pay Women] VAR _m = [Median Pay Men] RETURN IF ( NOT ISBLANK ( _w ) && NOT ISBLANK ( _m ), 1 - DIVIDE ( _w, _m ) )
Step 14: Update it, then find the cause
When roles are filled, set their Status to Filled with the Closed date in Recruitment, add the new people to Employees with their hire date, save and click Refresh: headcount, hires, open roles and time to fill update.
Pick a department in the slicer to filter every page. In the sample, Customer Support has 39% turnover (24% a year ago), 20 of its 31 leavers left in their first year, and pay and workload are the top reasons.
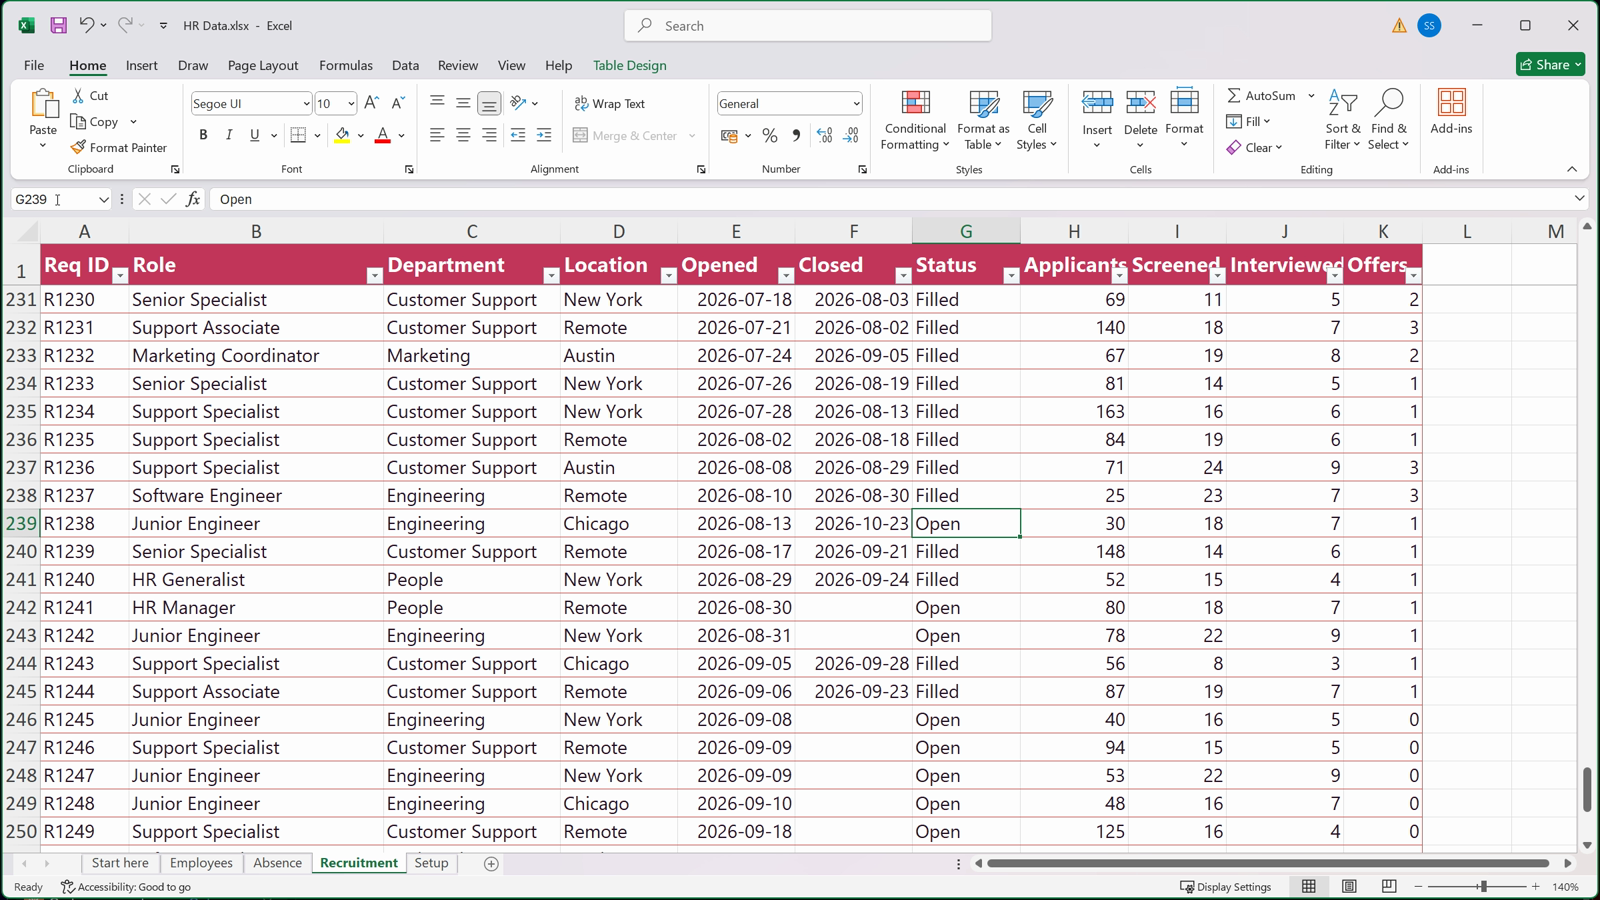
Two roles filled
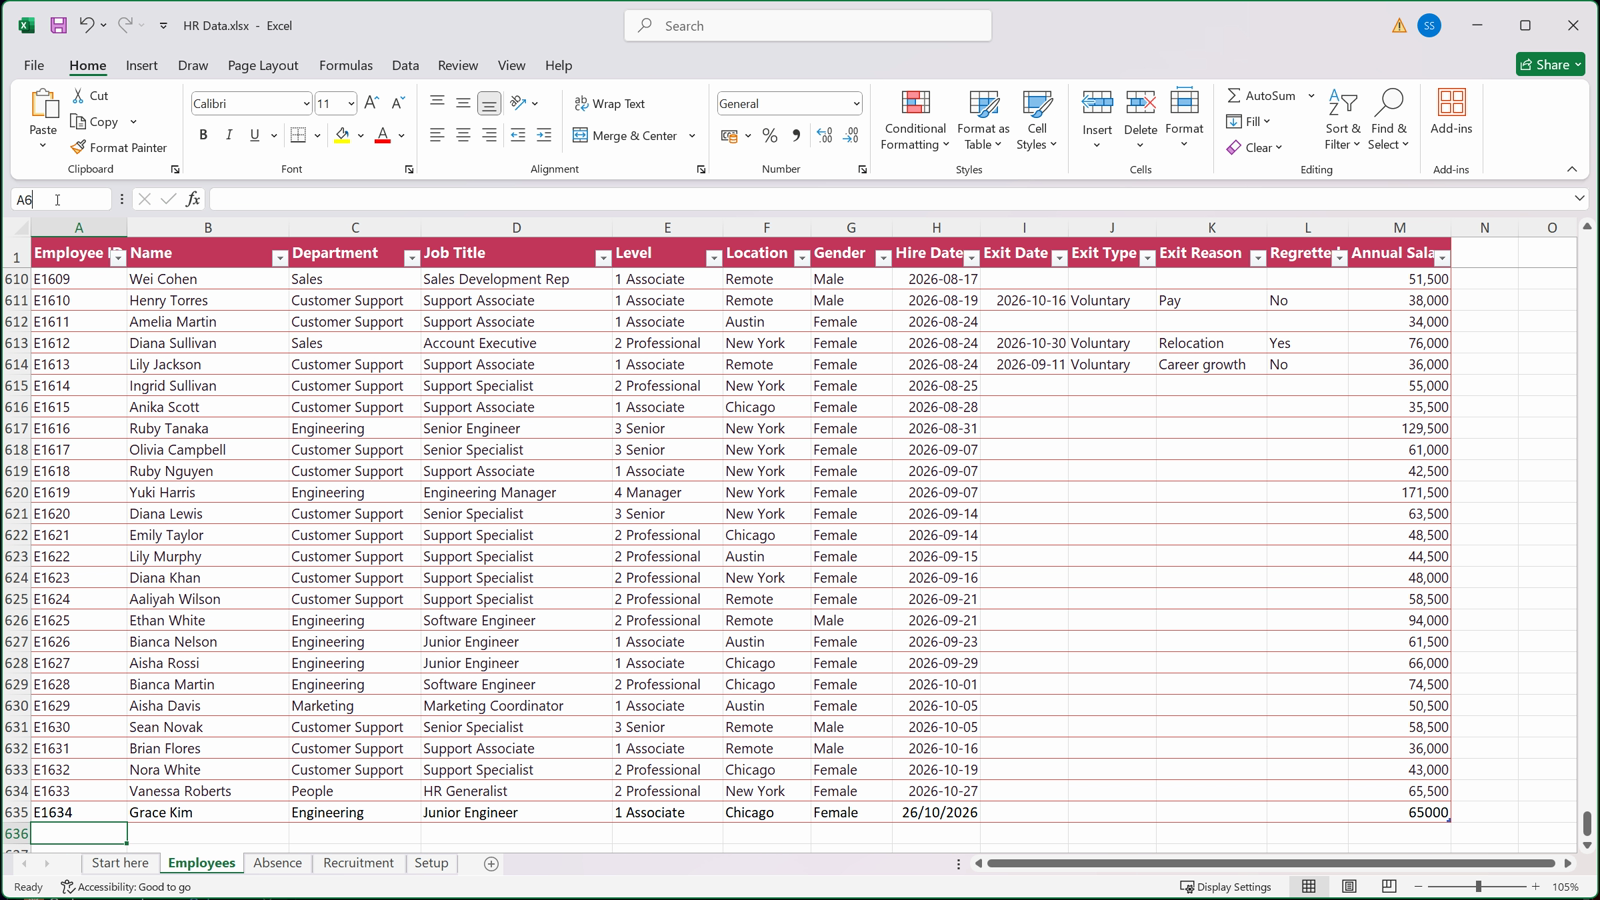
Two new people
Wrap-up
You’ve now built a complete HR workforce dashboard: forgiving Power Query steps for an HR export, a date table with inactive relationships switched on by USERELATIONSHIP, headcount on any date, rolling 12-month turnover against a target, a hiring funnel and pay by level, and an app-style design with cards drawn by DAX.
If you’d rather start from the finished file, the ready-made template includes the dashboard, the Excel workbook and a step-by-step setup guide.
Prefer the ready-made template? Get HR Workforce for $19, with the dashboard, the Excel file and a step-by-step guide: Click to Buy
More dashboards: https://www.youtube.com/@PivotalstatsProjects · https://pivotalstats.com