Log sales and purchase orders in Excel, click Refresh, and see what to order today and where your cash is stuck.
Inventory & Reorder is a Power BI dashboard for owners, buyers and operations leads at online sellers, wholesalers and shops who keep stock, sales and purchase orders in Excel. Fill one Excel workbook, click Refresh, and you get your stock on hand, what to order today, which suppliers deliver late, and which stock is tying up your cash.
It answers the questions a weekly stock meeting needs: are we running out, what does it cost us in lost sales, what should we order and how much, which supplier is the problem, and which products should we stop buying.
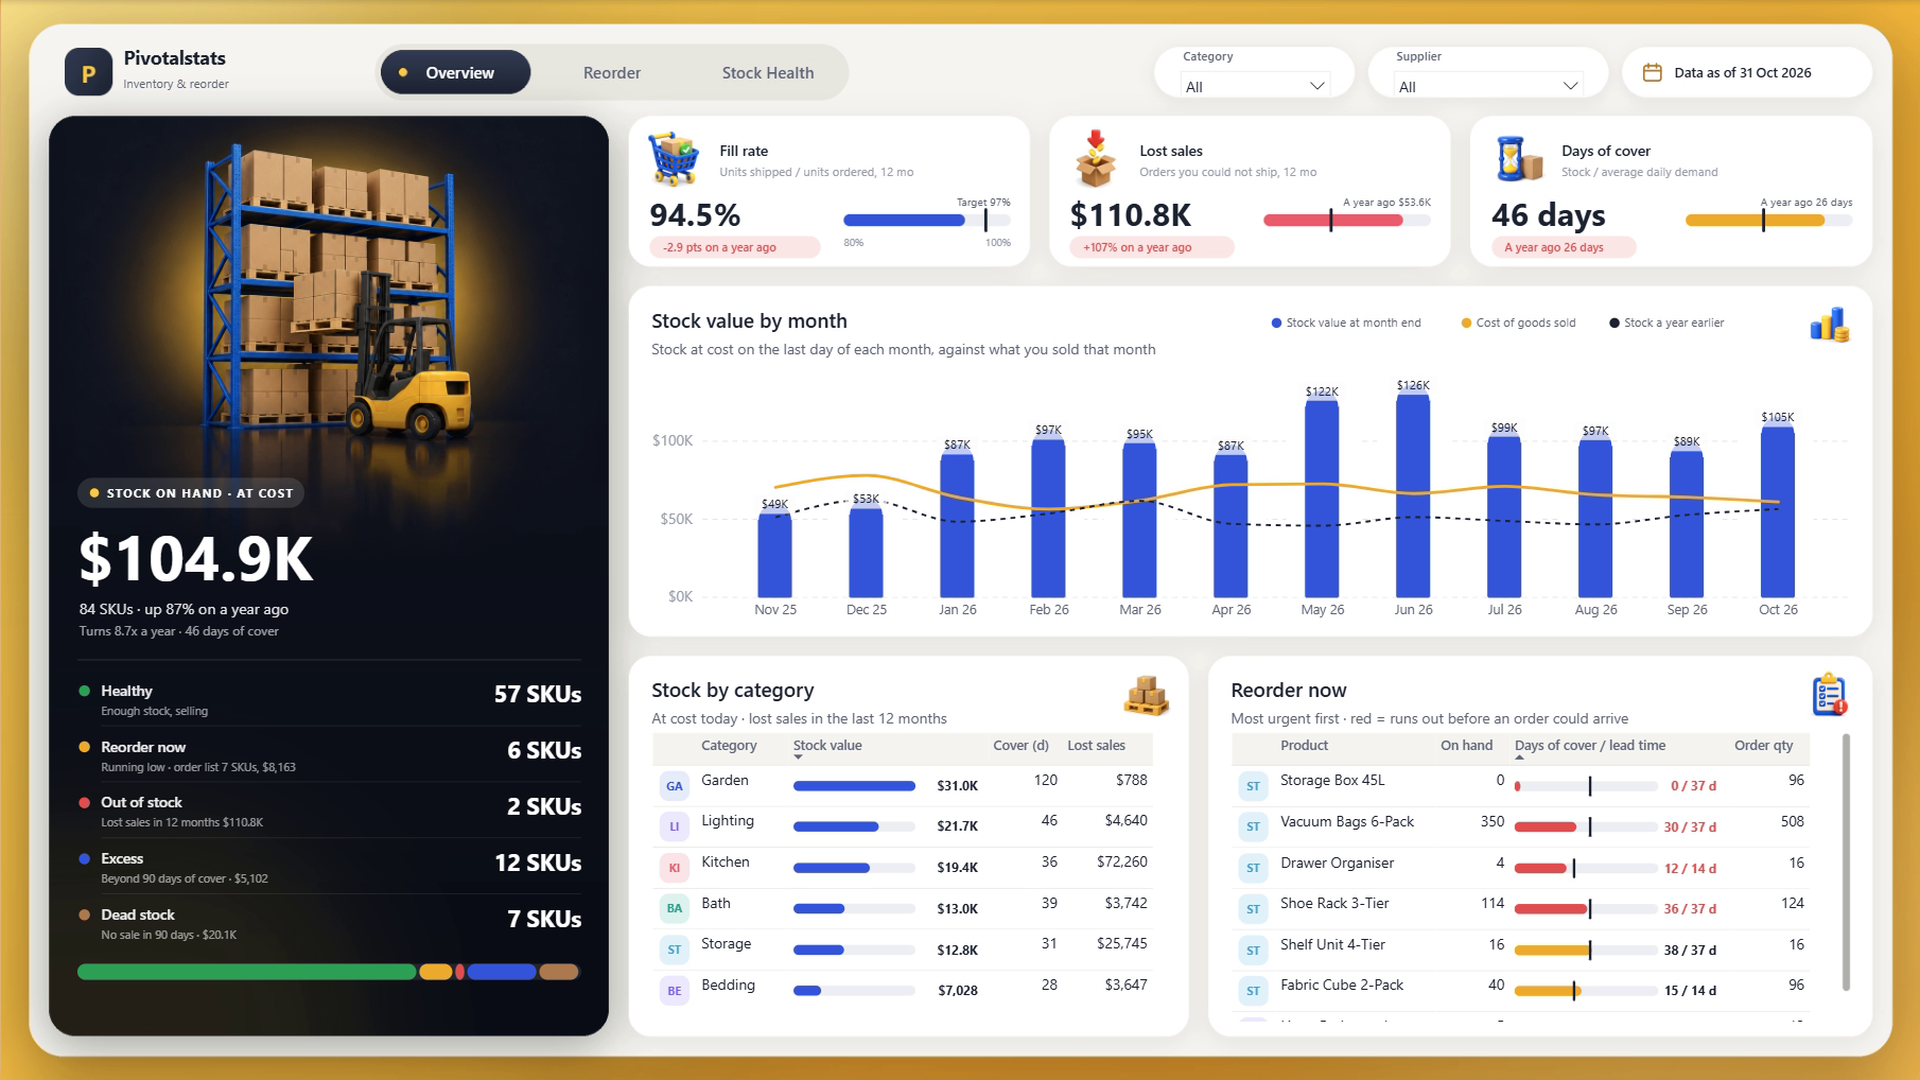
The finished Inventory & Reorder dashboard
Prefer the ready-made template? Get Inventory & Reorder for $19, with the dashboard, the Excel file and a step-by-step guide: Click to Buy
Watch the full build on YouTube: https://www.youtube.com/@PivotalstatsProjects (Click to View)
What you need
- Power BI Desktop from Microsoft (Windows), 2025 or newer
- Microsoft Excel
- The sample data file Inventory Tracker.xlsx: Click to Download
What you’ll build
An inventory and reorder dashboard in Power BI, built from one Excel workbook: stock on hand worked out from every movement, a status for every product, fill rate and lost sales, a reorder list with order quantities based on each supplier’s real lead time, a supplier scorecard, an ABC analysis and the cash tied up in dead and excess stock.
It uses Power Query, a small model with three fact tables, a DAX date table, DAX measures and only Microsoft’s standard visuals. The hero column, the cards and the bars are SVG measures, and the logo, icons and illustrations are separate objects you can replace.
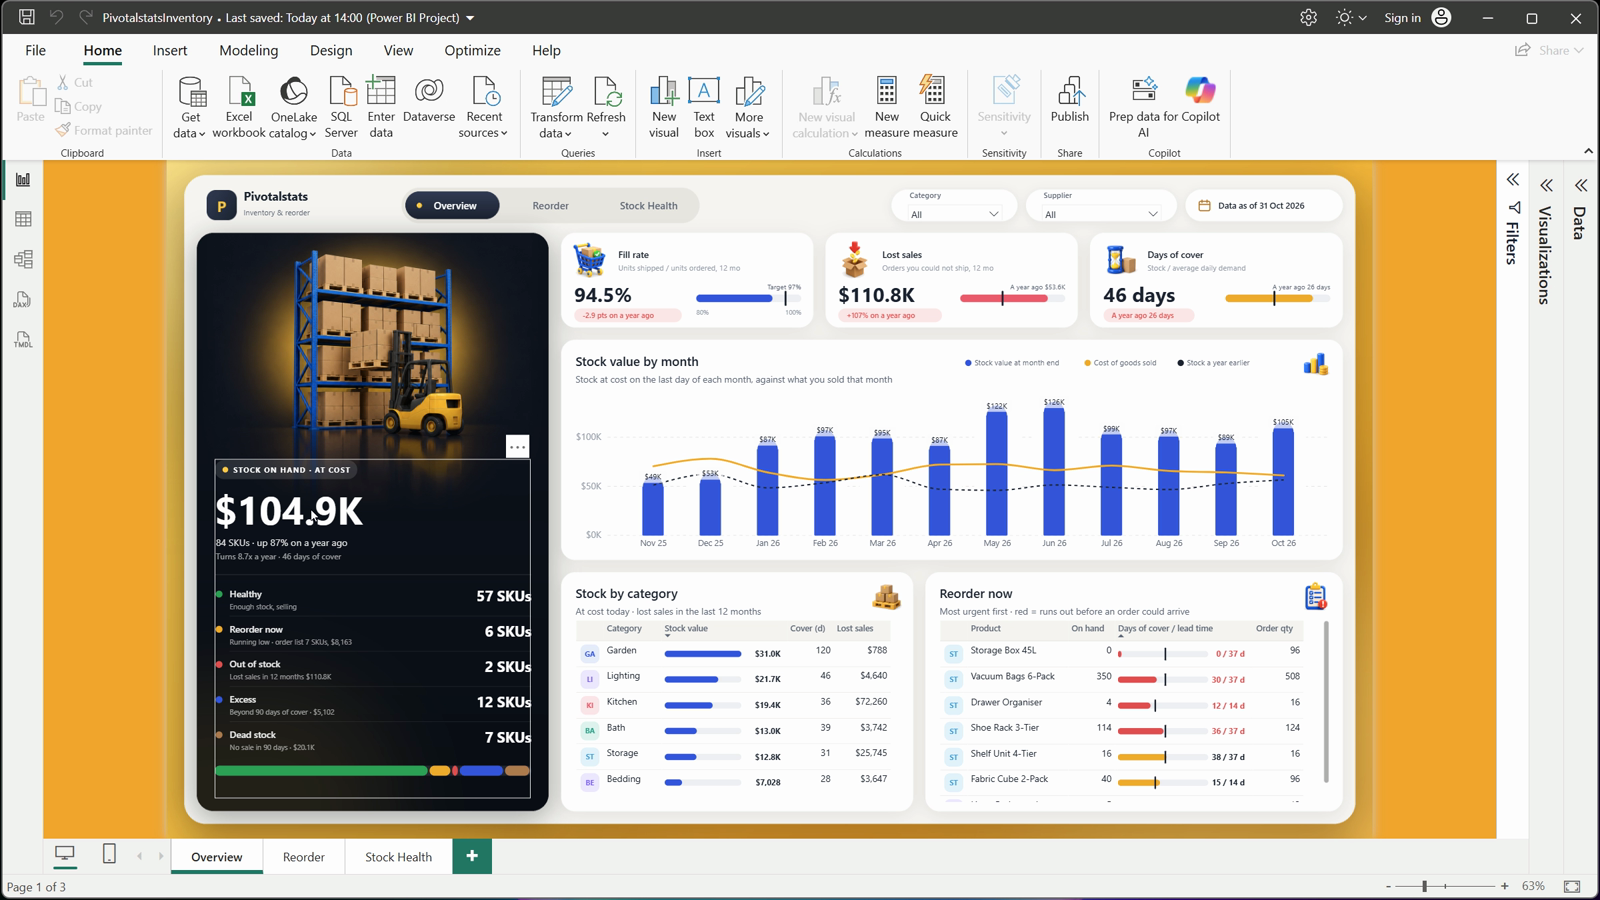
Stock $104.9K
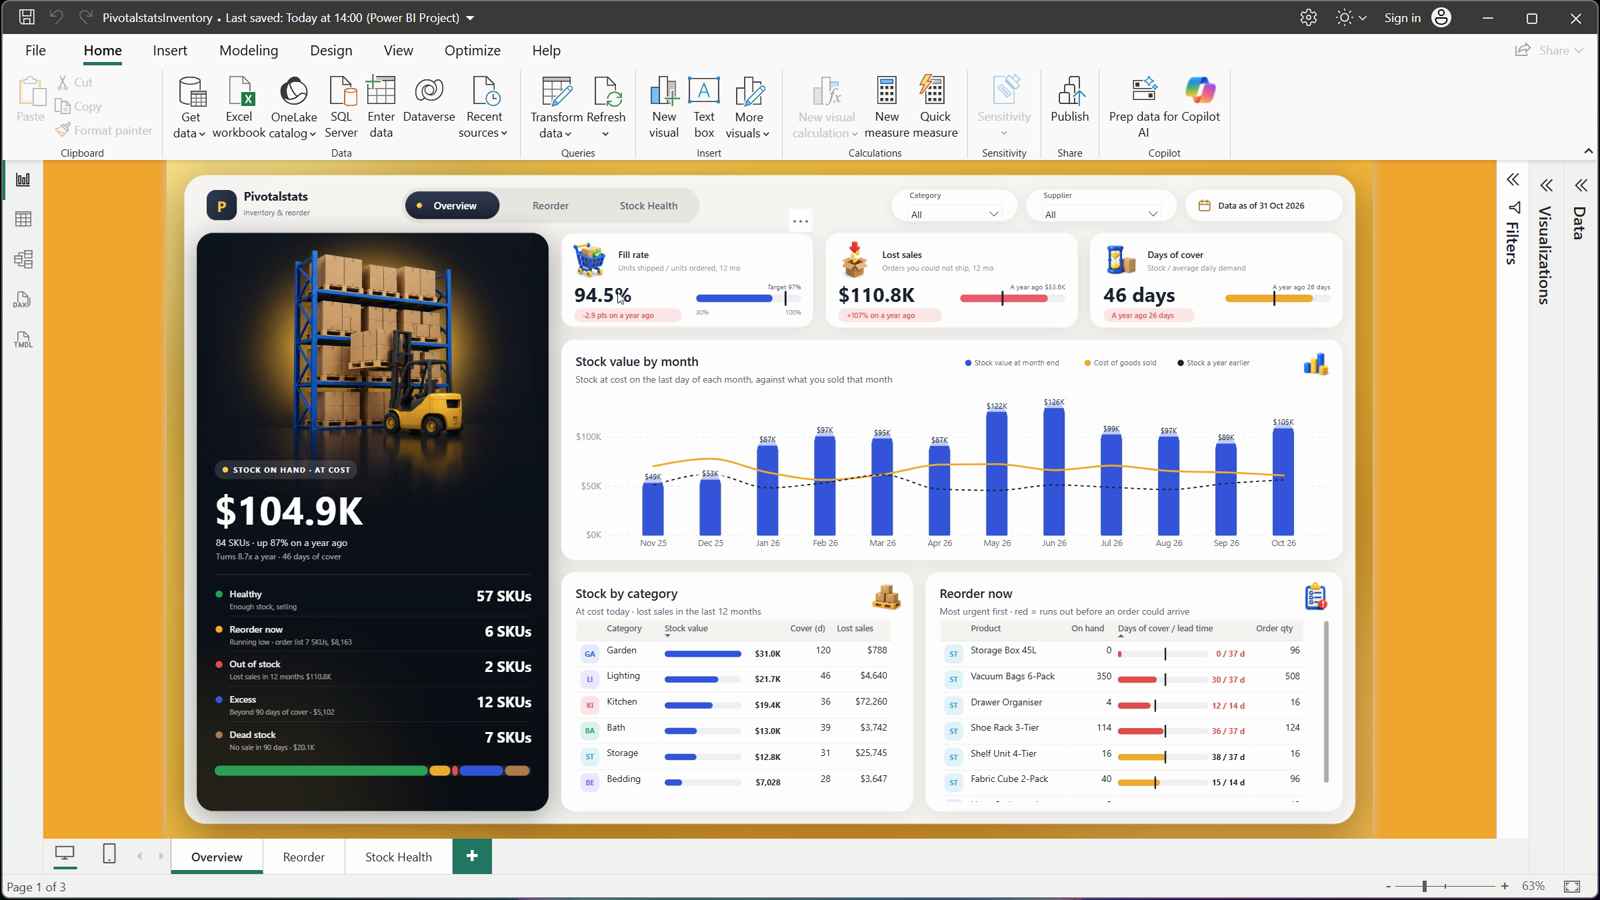
Fill rate 94.5%
Step 01: The three pages
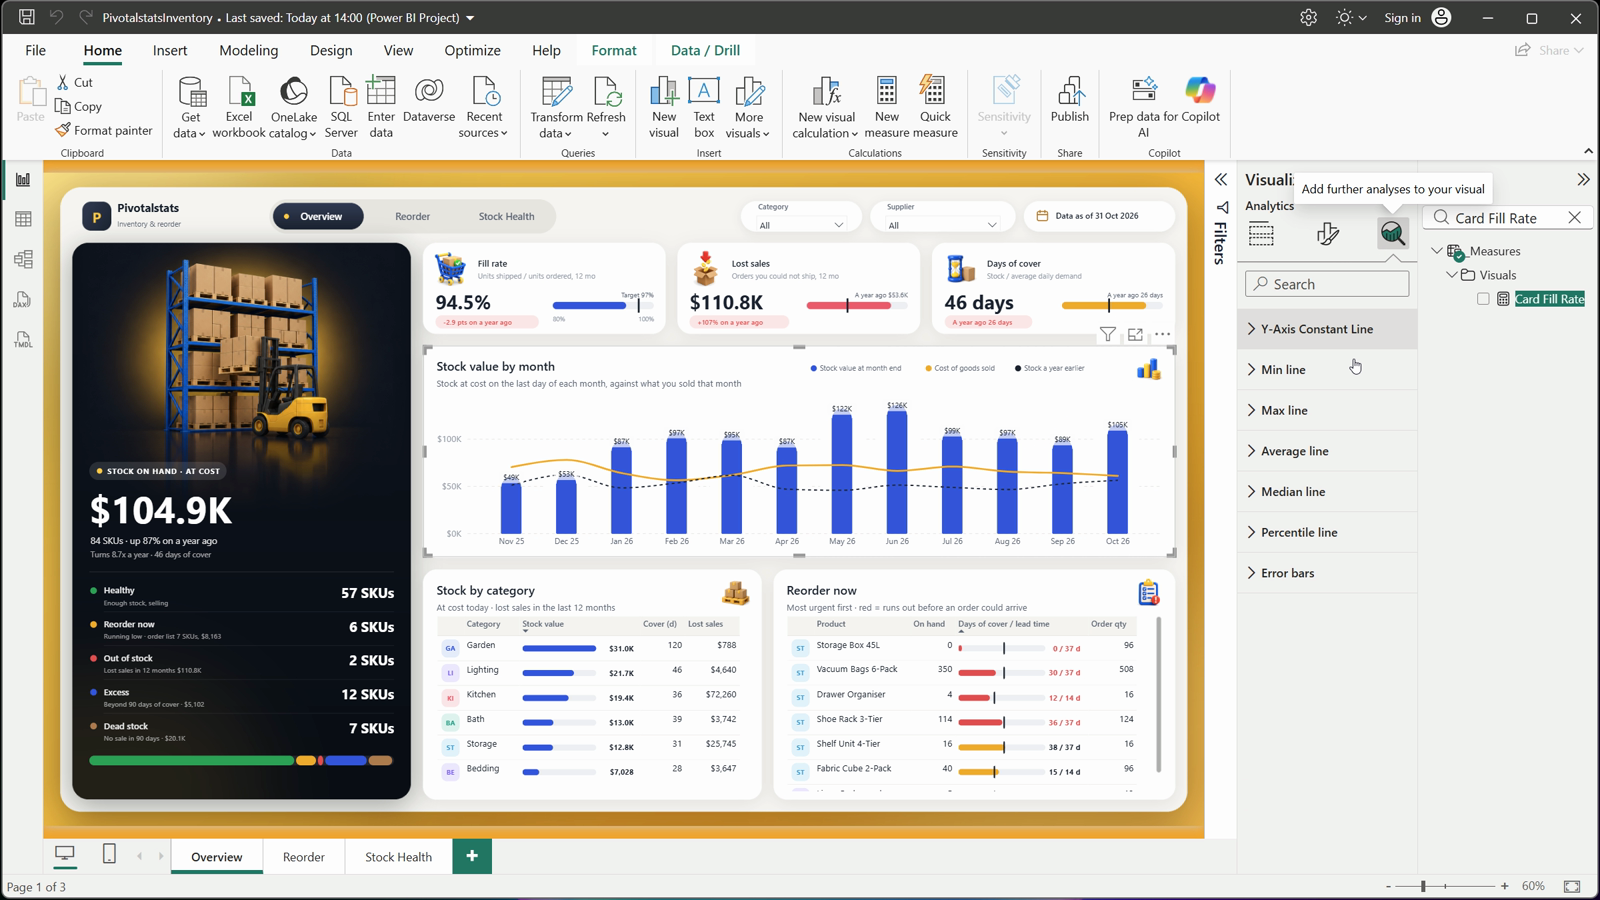
Overview: stock on hand at cost with every product’s status (healthy, reorder now, out of stock, excess, dead stock), cards for fill rate, lost sales and days of cover, stock value by month, stock by category and the products to reorder now.
Reorder: open purchase orders, the full reorder list with quantities and values, and a supplier scorecard. Stock Health: the cash tied up in dead and excess stock, an ABC analysis and every dead or excess product. The Category and Supplier slicers filter every page.
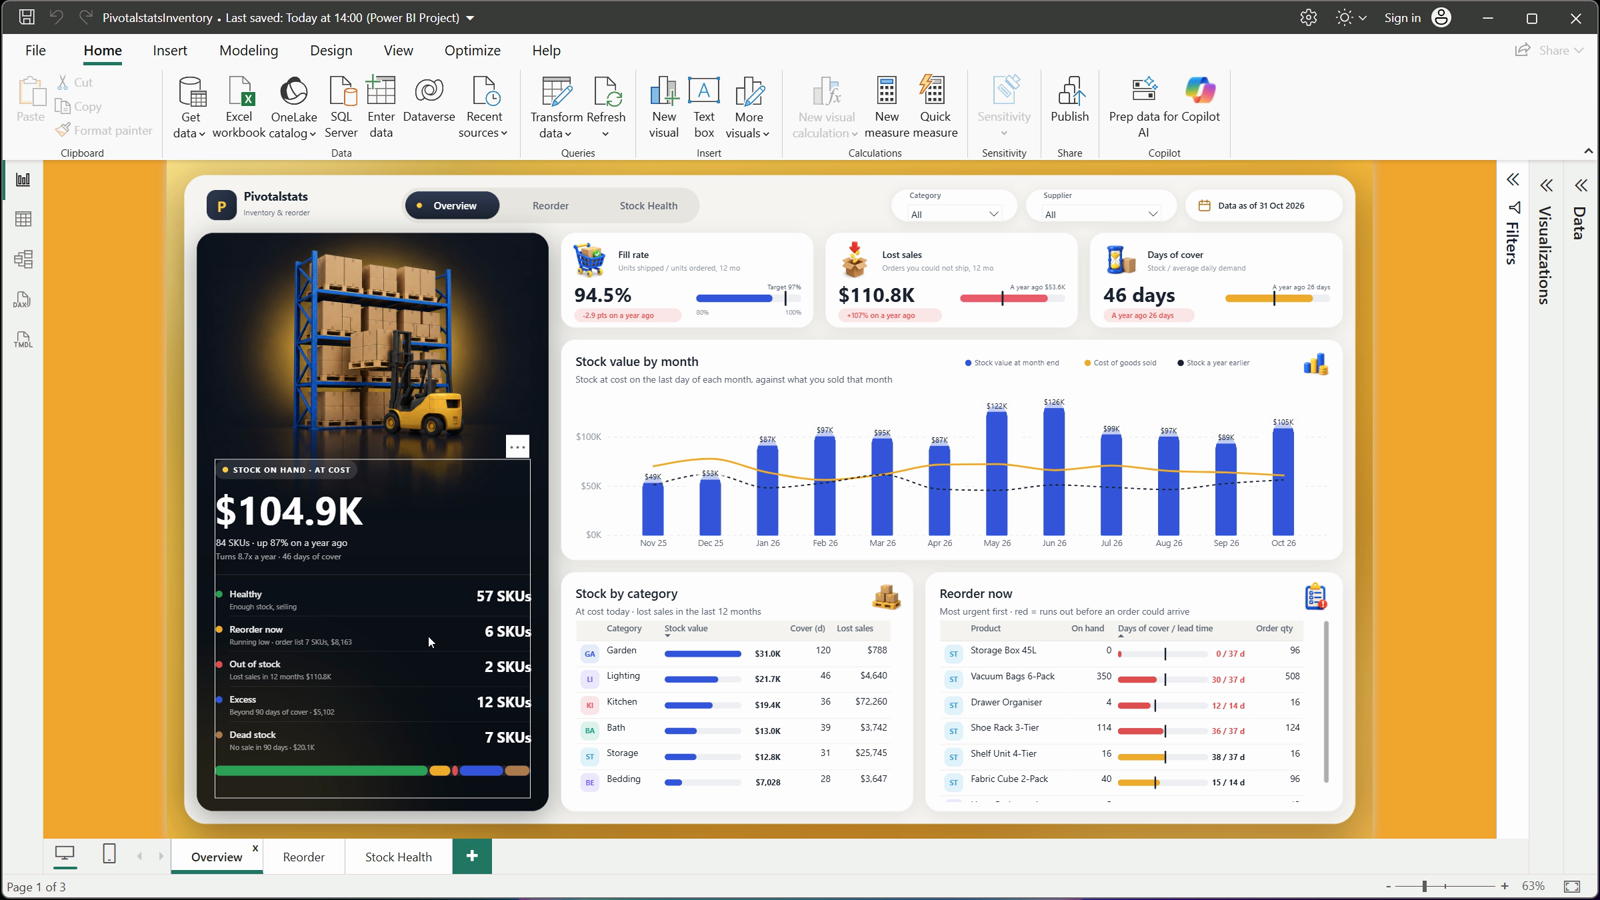
Every product gets a status
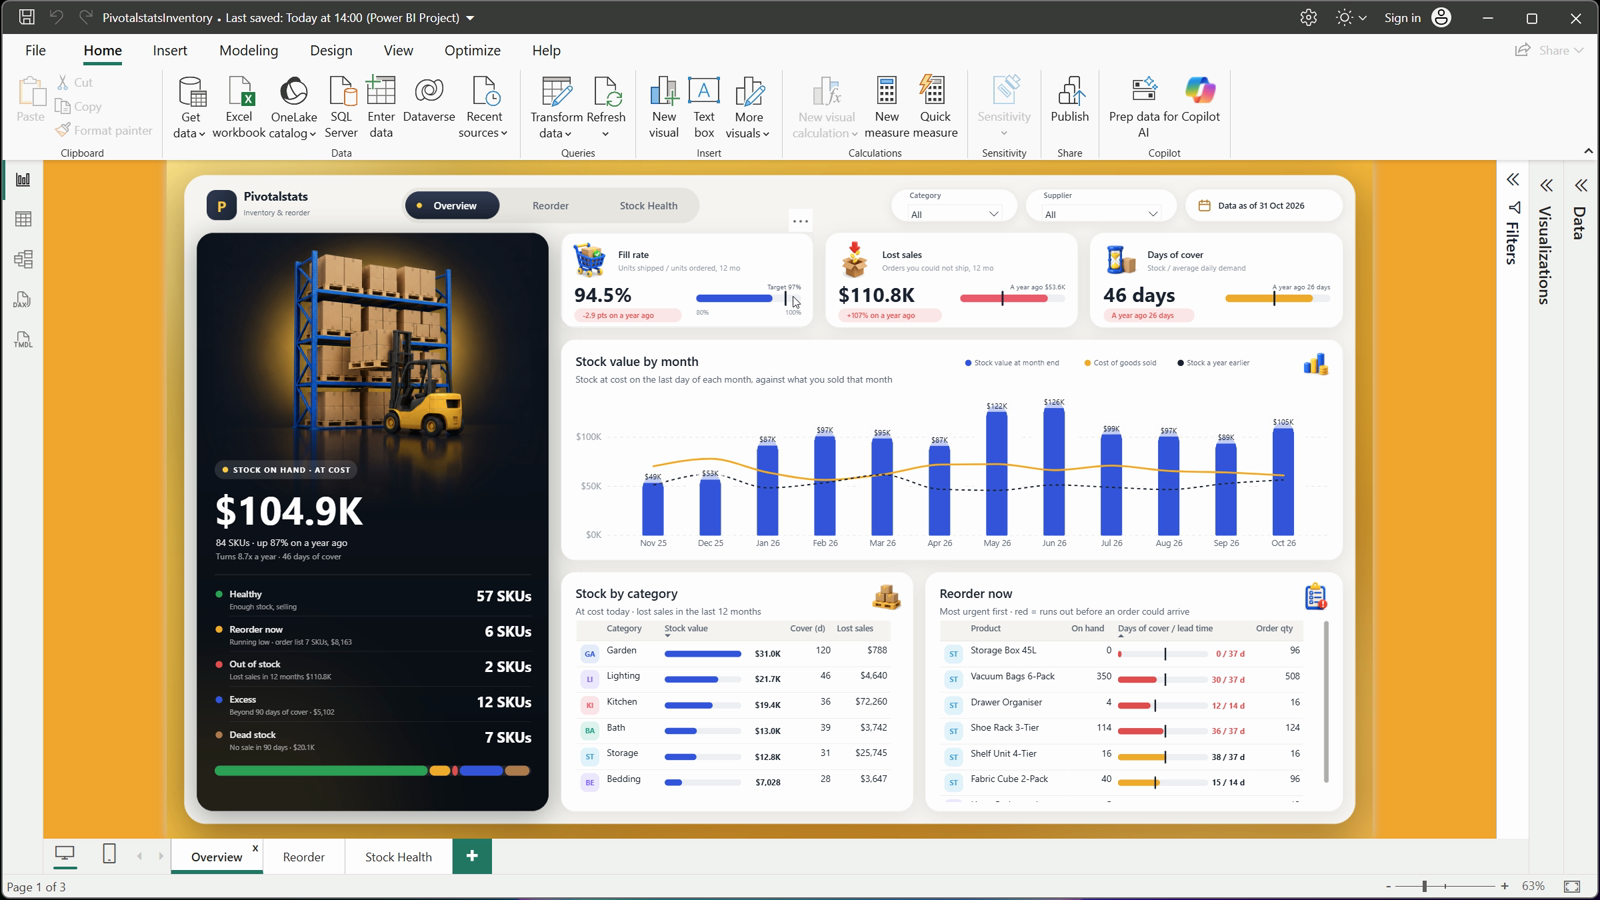
Three KPI cards
Step 02: The workbook: two lists, four logs and a setup tab
Products lists each SKU once with its Category, Supplier, Unit Cost, Unit Price and Case Pack (the order multiple); Suppliers holds each supplier’s promised Lead Time Days. Sales has Qty Ordered and Qty Shipped per SKU per day: shipped less than ordered is a lost sale.
Purchases is the purchase-order log with Order, Expected and Received Date; an order without a Received Date is still on order. Adjustments holds damaged items and count corrections, Stock Count the counted stock on one date, and Setup the report date and targets. Every tab is an Excel table, so pasted rows are picked up on the next refresh.
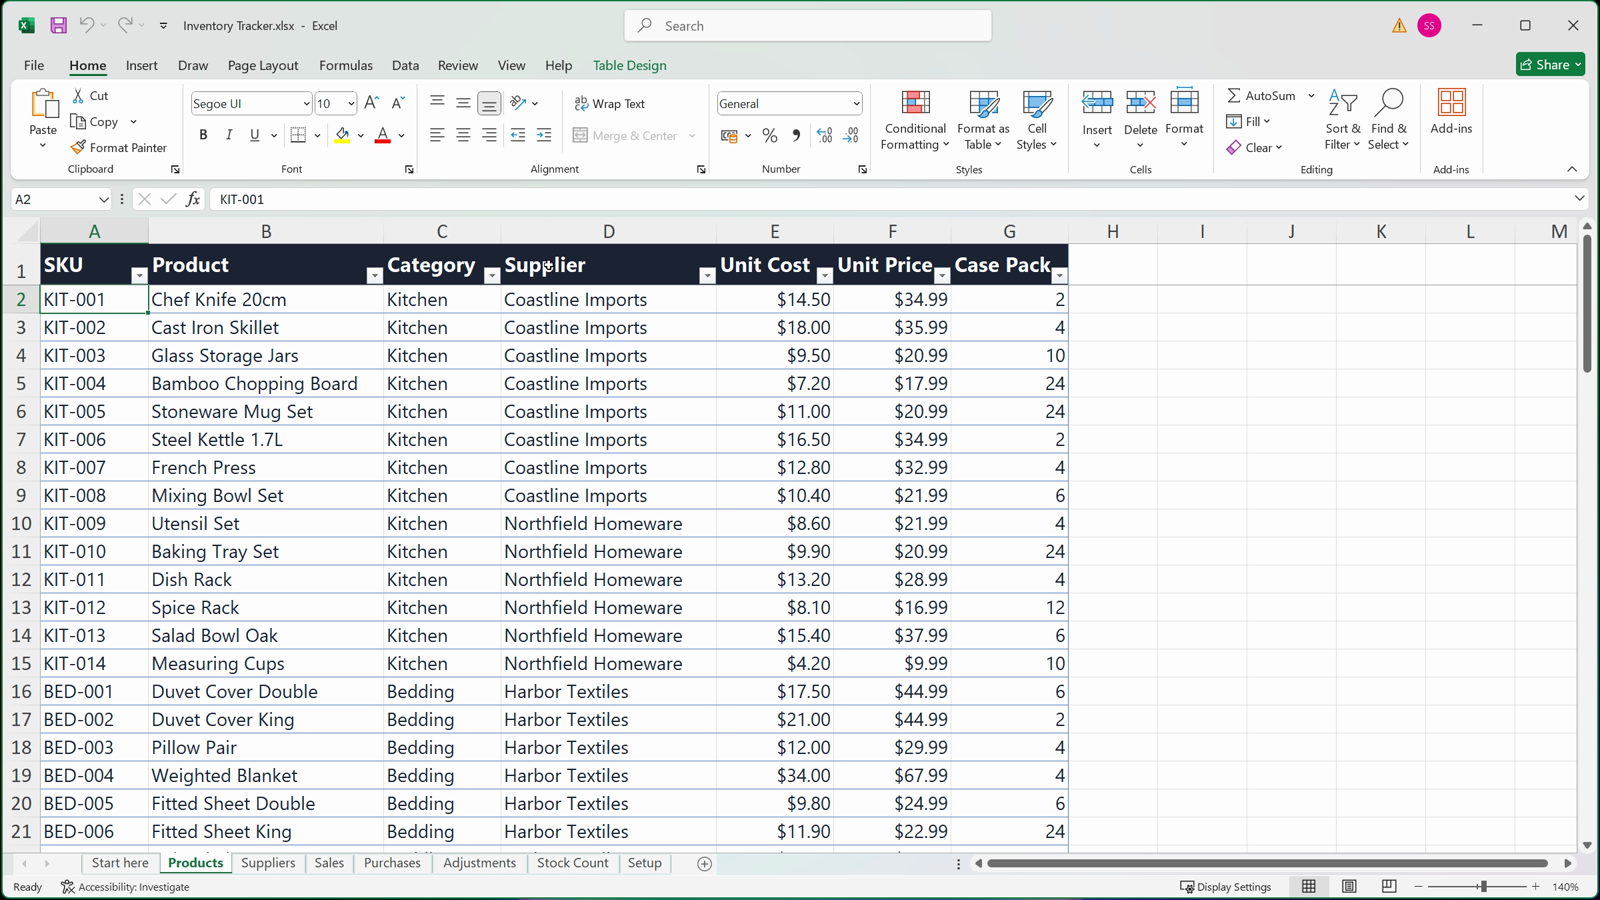
Products
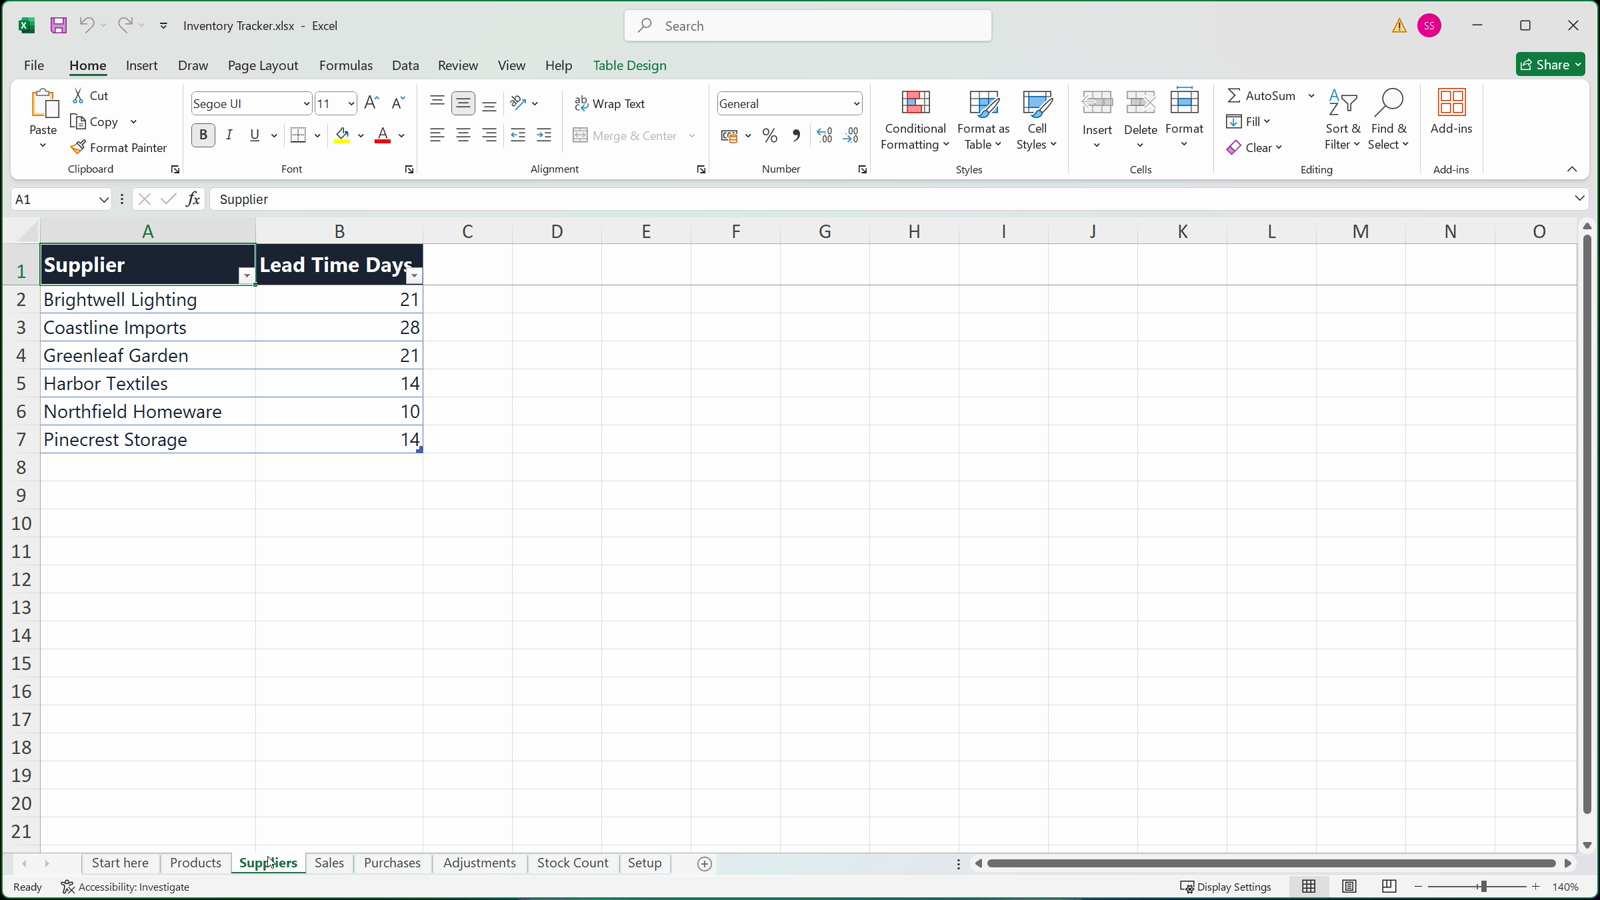
Suppliers
Step 03: Connect once, through a parameter
A text parameter, DataFile, holds the full path to the workbook. A blank query called Workbook opens it with Excel.Workbook and lists every sheet and table; the other queries start from it and read the tables, not the sheets. Workbook itself has Enable load switched off.
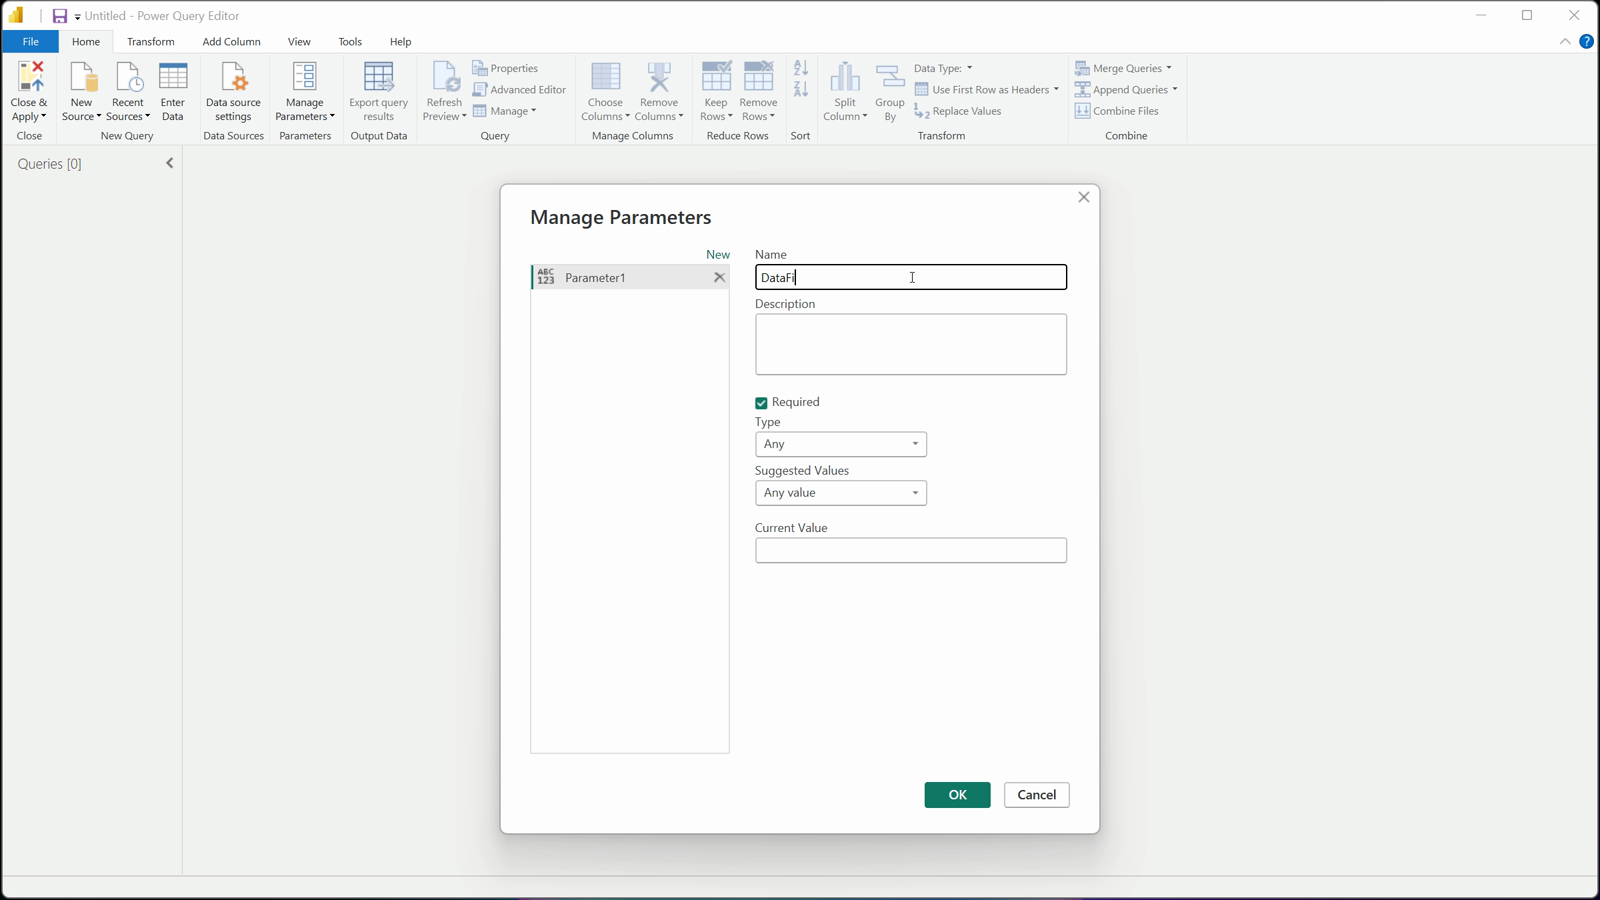
DataFile parameter
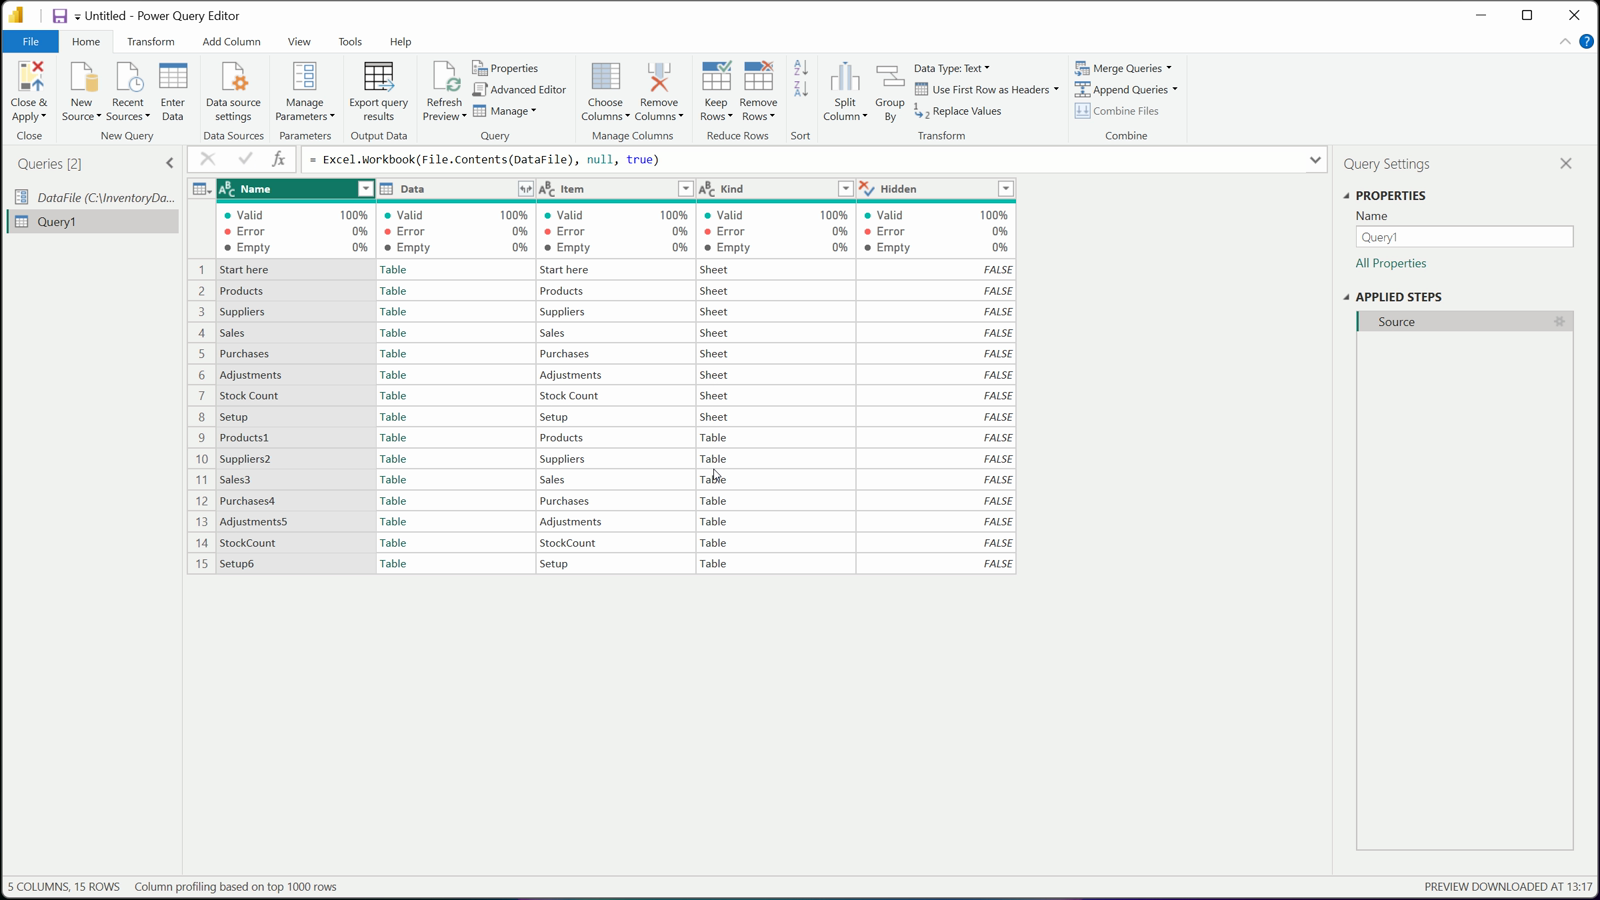
Read the tables
M
let

      Source = Excel.Workbook(File.Contents(DataFile), null, true)

  in

Source
Step 04: Clean the sales and purchase logs
SalesRaw selects its four columns with MissingField.UseNull (a missing column arrives empty), renames, trims and types them, removes rows whose date or numbers fail to convert and keeps rows with a date and a SKU. A blank Qty Shipped becomes the ordered quantity; because a replace step with a function drops the column type, the next step types it as a number again.
PurchasesRaw follows the same pattern and adds LeadDays (received date minus order date) and DaysLate (received date minus expected date); both stay empty while an order is open.
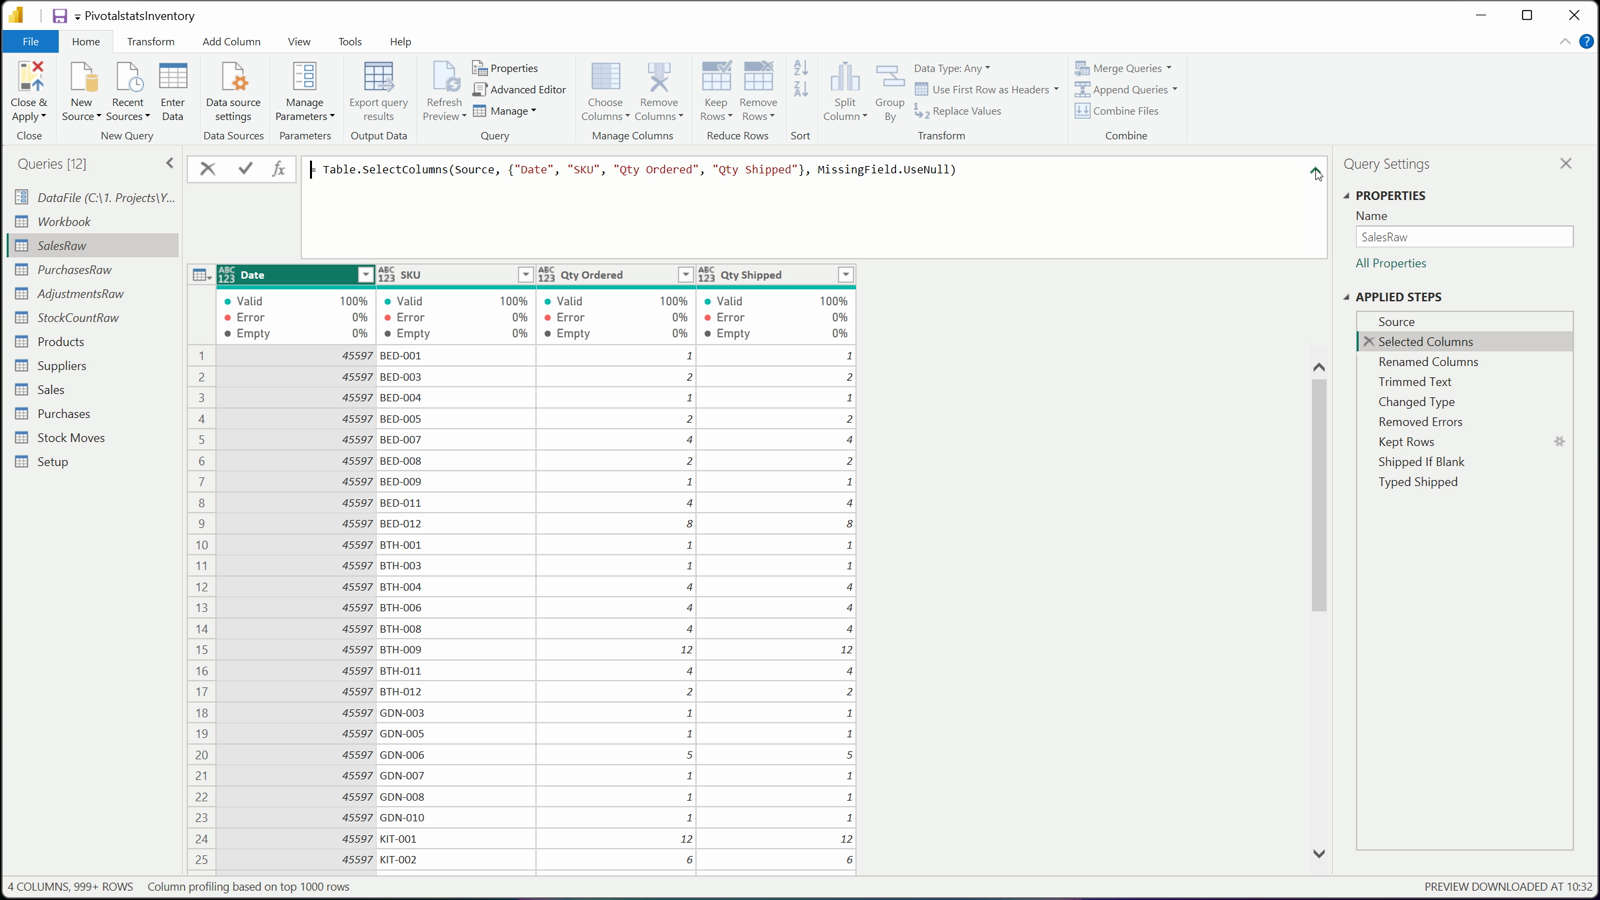
MissingField.UseNull
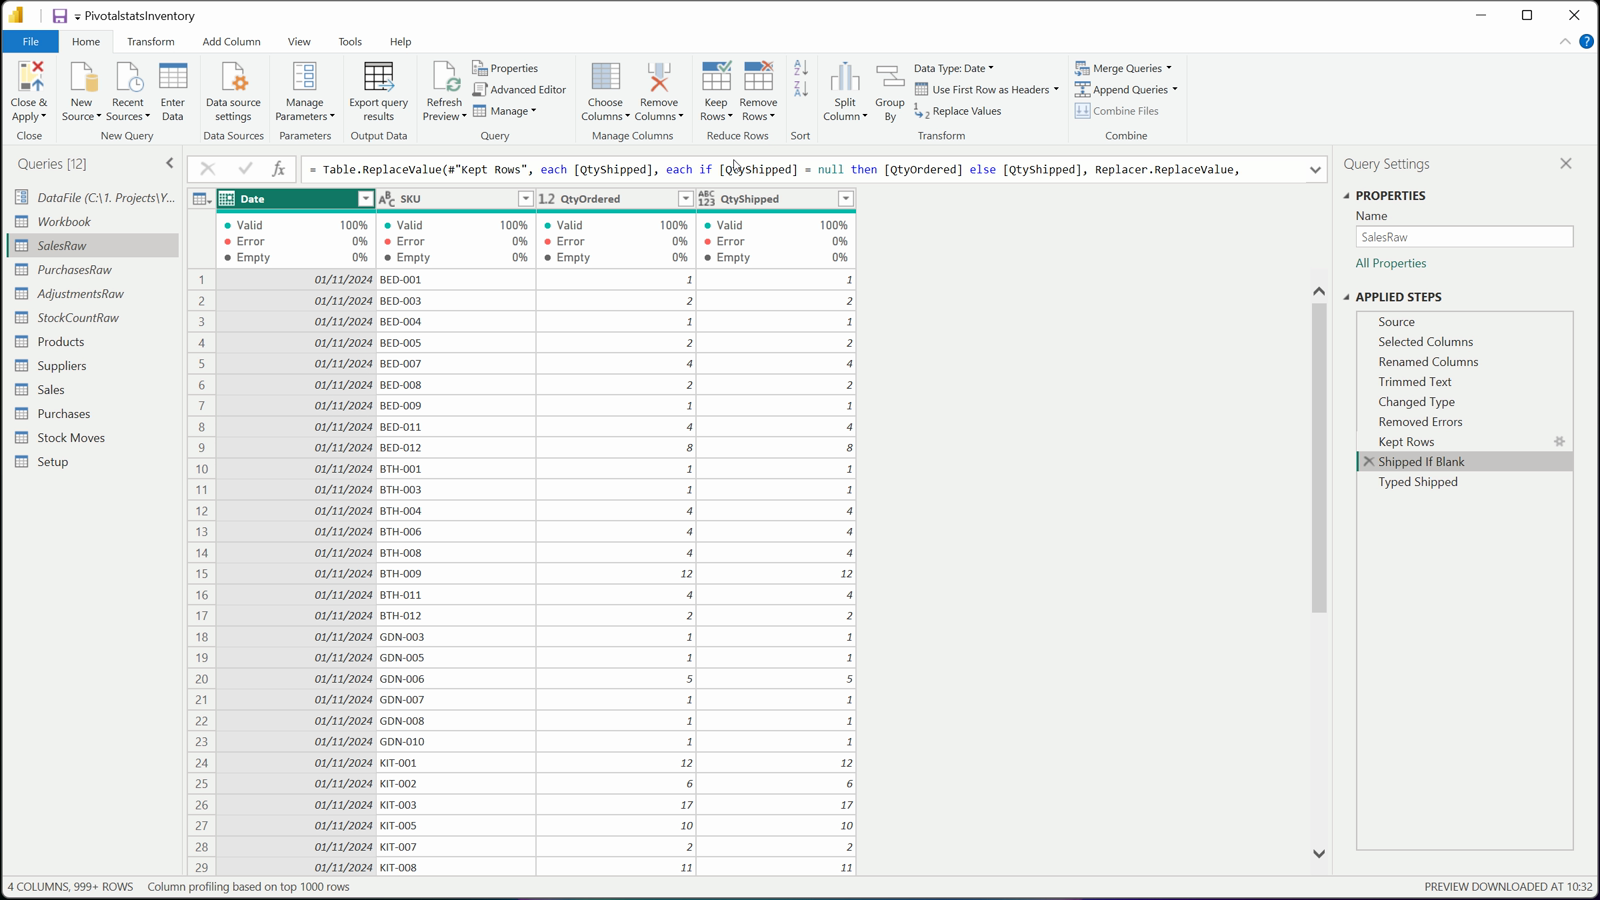
Shipped If Blank
M
let

      Source = Workbook{[Item = "Sales", Kind = "Table"]}[Data],

      #"Selected Columns" = Table.SelectColumns(Source, {"Date", "SKU", "Qty Ordered", "Qty Shipped"}, MissingField.UseNull),

      #"Renamed Columns" = Table.RenameColumns(#"Selected Columns", {{"Qty Ordered", "QtyOrdered"}, {"Qty Shipped", "QtyShipped"}}),

      #"Trimmed Text" = Table.TransformColumns(#"Renamed Columns", {{"SKU", each if _ = null then null else Text.Trim(Text.From(_)), type text}}),

      #"Changed Type" = Table.TransformColumnTypes(#"Trimmed Text", {{"Date", type date}, {"QtyOrdered", type number}, {"QtyShipped", type number}}, "en-US"),

      #"Removed Errors" = Table.RemoveRowsWithErrors(#"Changed Type", {"Date", "QtyOrdered", "QtyShipped"}),

      #"Kept Rows" = Table.SelectRows(#"Removed Errors", each [Date] <> null and [SKU] <> null and [SKU] <> "" and [QtyOrdered] <> null),

      #"Shipped If Blank" = Table.ReplaceValue(#"Kept Rows", each [QtyShipped], each if [QtyShipped] = null then [QtyOrdered] else [QtyShipped], Replacer.ReplaceValue, {"QtyShipped"}),

      #"Typed Shipped" = Table.TransformColumnTypes(#"Shipped If Blank", {{"QtyShipped", type number}})

  in

#"Typed Shipped"
M
let

      Source = Workbook{[Item = "Purchases", Kind = "Table"]}[Data],

      #"Selected Columns" = Table.SelectColumns(Source, {"PO Number", "SKU", "Order Date", "Expected Date", "Received Date", "Qty Ordered", "Qty Received"}, MissingField.UseNull),

      #"Renamed Columns" = Table.RenameColumns(#"Selected Columns", {{"PO Number", "PONumber"}, {"Order Date", "OrderDate"}, {"Expected Date", "ExpectedDate"}, {"Received Date", "ReceivedDate"}, {"Qty Ordered", "QtyOrdered"}, {"Qty Received", "QtyReceived"}}),

      #"Trimmed Text" = Table.TransformColumns(#"Renamed Columns", {{"PONumber", each if _ = null then null else Text.Trim(Text.From(_)), type text}, {"SKU", each if _ = null then null else Text.Trim(Text.From(_)), type text}}),

      #"Changed Type" = Table.TransformColumnTypes(#"Trimmed Text", {{"OrderDate", type date}, {"ExpectedDate", type date}, {"ReceivedDate", type date}, {"QtyOrdered", type number}, {"QtyReceived", type number}}, "en-US"),

      #"Removed Errors" = Table.RemoveRowsWithErrors(#"Changed Type", {"OrderDate", "ExpectedDate", "ReceivedDate", "QtyOrdered", "QtyReceived"}),

      #"Kept Rows" = Table.SelectRows(#"Removed Errors", each [OrderDate] <> null and [SKU] <> null and [SKU] <> "" and [QtyOrdered] <> null),

      #"Received If Blank" = Table.ReplaceValue(#"Kept Rows", each [QtyReceived], each if [QtyReceived] = null and [ReceivedDate] <> null then [QtyOrdered] else [QtyReceived], Replacer.ReplaceValue, {"QtyReceived"}),

      #"Expected If Blank" = Table.ReplaceValue(#"Received If Blank", each [ExpectedDate], each if [ExpectedDate] = null then [OrderDate] else [ExpectedDate], Replacer.ReplaceValue, {"ExpectedDate"}),

      #"Typed Filled Columns" = Table.TransformColumnTypes(#"Expected If Blank", {{"QtyReceived", type number}, {"ExpectedDate", type date}}),

      #"Added Lead Days" = Table.AddColumn(#"Typed Filled Columns", "LeadDays", each if [ReceivedDate] = null then null else Duration.Days([ReceivedDate] - [OrderDate]), type number),

      #"Added Days Late" = Table.AddColumn(#"Added Lead Days", "DaysLate", each if [ReceivedDate] = null then null else Duration.Days([ReceivedDate] - [ExpectedDate]), type number)

  in

#"Added Days Late"
Step 05: One table of stock movements
Stock Moves appends four sources with Table.Combine: the opening Stock Count (+), received purchase orders (+, on the received date), shipped sales (turned negative) and adjustments (already signed). Each part gets a MoveType, and zero moves are dropped.
Products keeps one row per SKU and names unnamed products after their SKU; Suppliers adds any supplier that appears in Products but not on its own tab, with a default 14-day lead time.
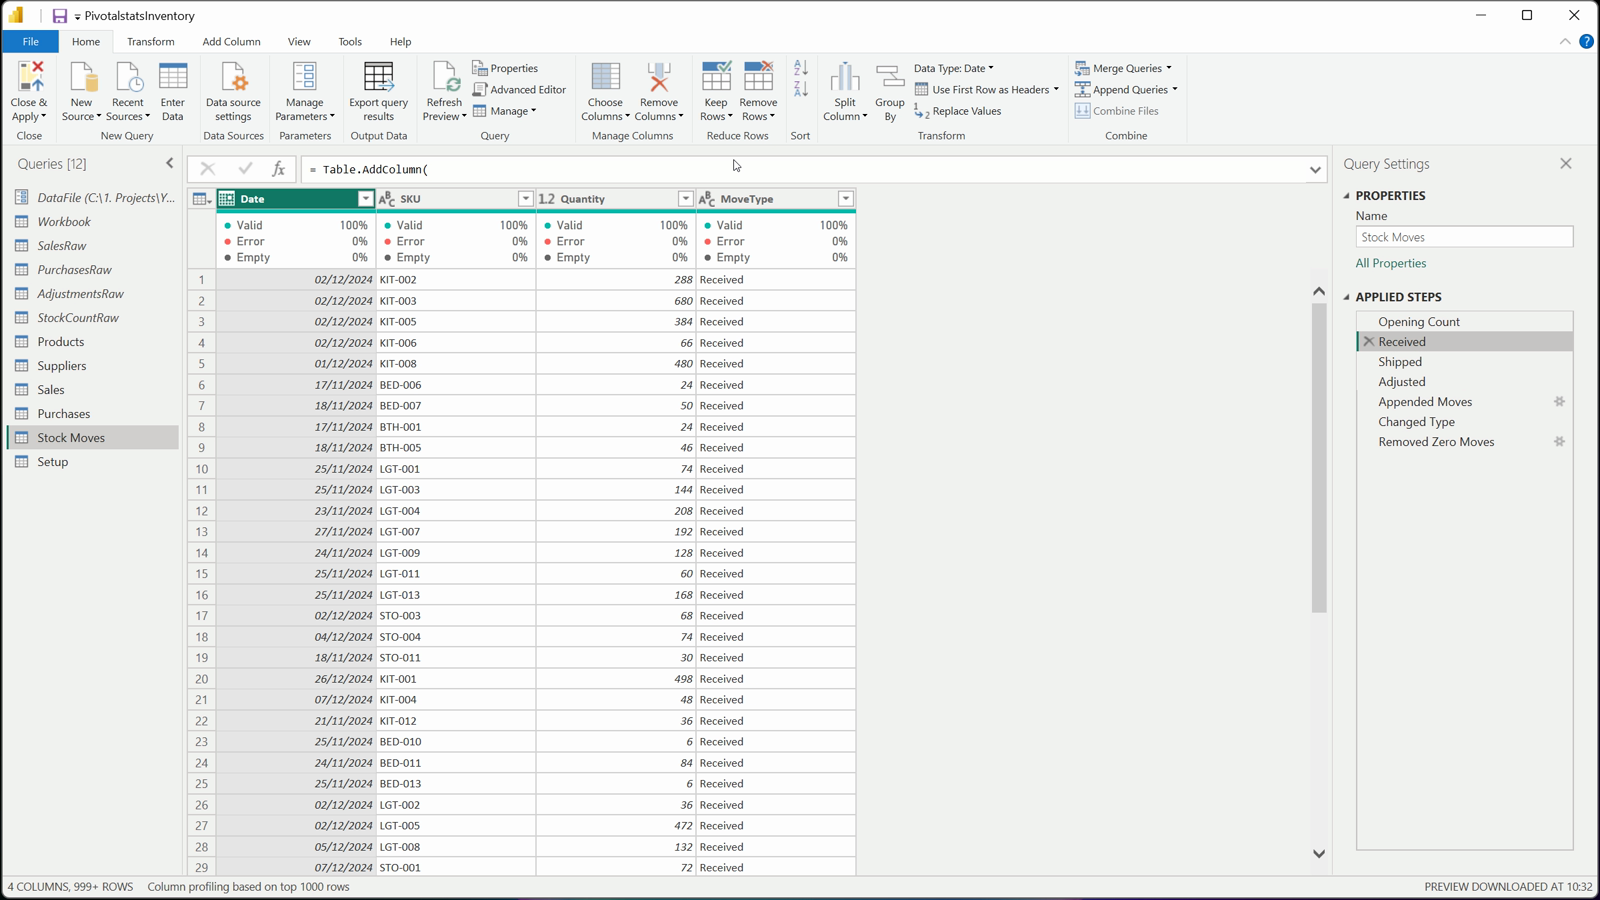
Stock Moves
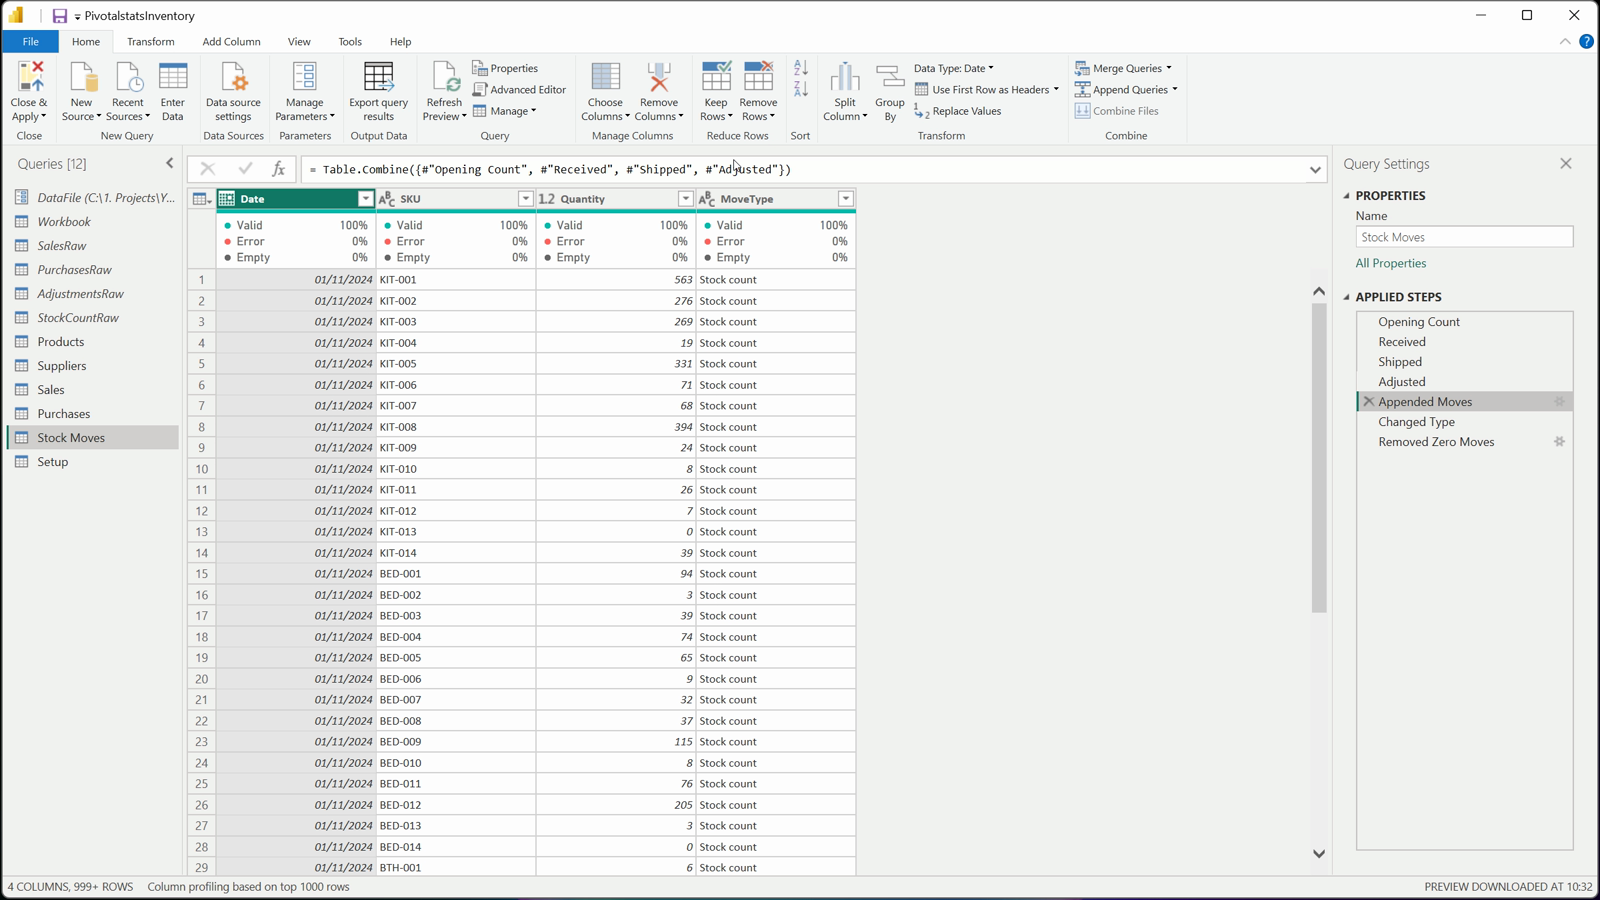
Table.Combine
M
let

      Source = Workbook{[Item = "StockCount", Kind = "Table"]}[Data],

      #"Selected Columns" = Table.SelectColumns(Source, {"SKU", "Count Date", "Quantity"}, MissingField.UseNull),

      #"Renamed Columns" = Table.RenameColumns(#"Selected Columns", {{"Count Date", "Date"}}),

      #"Trimmed Text" = Table.TransformColumns(#"Renamed Columns", {{"SKU", each if _ = null then null else Text.Trim(Text.From(_)), type text}}),

      #"Changed Type" = Table.TransformColumnTypes(#"Trimmed Text", {{"Date", type date}, {"Quantity", type number}}, "en-US"),

      #"Removed Errors" = Table.RemoveRowsWithErrors(#"Changed Type", {"Date", "Quantity"}),

      #"Kept Rows" = Table.SelectRows(#"Removed Errors", each [Date] <> null and [SKU] <> null and [SKU] <> "" and [Quantity] <> null)

  in

#"Kept Rows"
M
let

      Source = Workbook{[Item = "Adjustments", Kind = "Table"]}[Data],

      #"Selected Columns" = Table.SelectColumns(Source, {"Date", "SKU", "Quantity", "Reason"}, MissingField.UseNull),

      #"Trimmed Text" = Table.TransformColumns(#"Selected Columns", {{"SKU", each if _ = null then null else Text.Trim(Text.From(_)), type text}, {"Reason", each if _ = null then null else Text.Trim(Text.From(_)), type text}}),

      #"Changed Type" = Table.TransformColumnTypes(#"Trimmed Text", {{"Date", type date}, {"Quantity", type number}}, "en-US"),

      #"Removed Errors" = Table.RemoveRowsWithErrors(#"Changed Type", {"Date", "Quantity"}),

      #"Kept Rows" = Table.SelectRows(#"Removed Errors", each [Date] <> null and [SKU] <> null and [SKU] <> "" and [Quantity] <> null),

      #"Default Reason" = Table.ReplaceValue(#"Kept Rows", null, "Not given", Replacer.ReplaceValue, {"Reason"})

  in

#"Default Reason"
Step 06: A model with three fact tables
The Date table is DAX: it reads the report date from Setup (or uses today), runs from two years before it to the end of the report month, and adds Month Year for chart labels and MonthOffset for the last 12 months. It is marked as a date table.
Sales, Purchases and Stock Moves relate to Products by SKU, and Products relates to Suppliers, so the Supplier slicer filters every fact through its products. Sales and Stock Moves also relate to Date; Purchases has three dates, so its measures filter them directly.
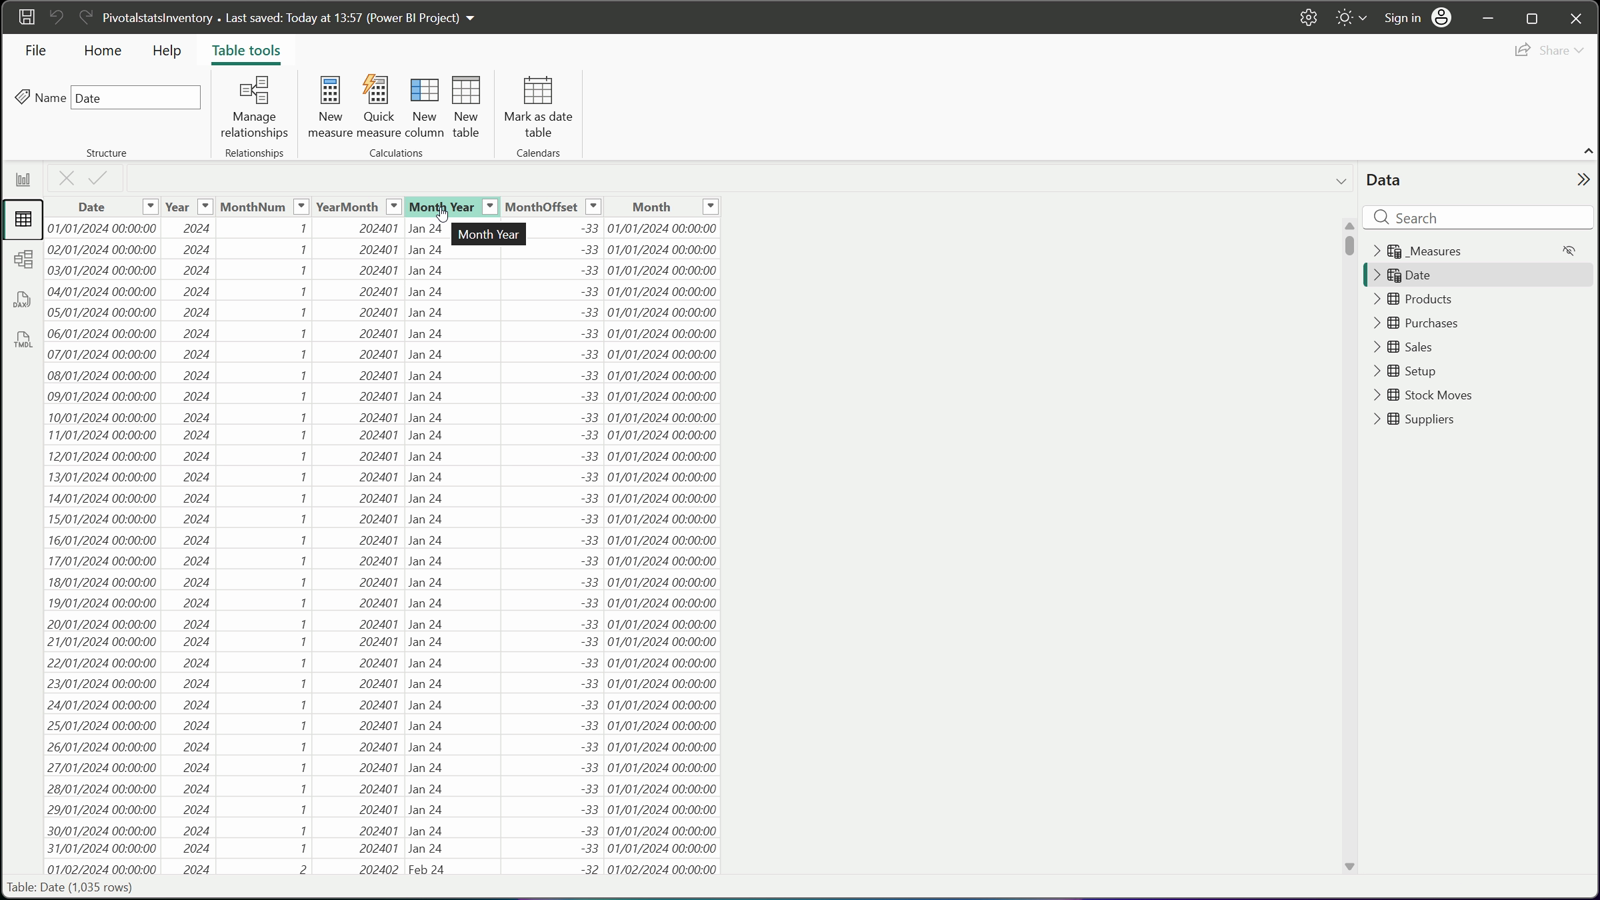
Month Year and MonthOffset
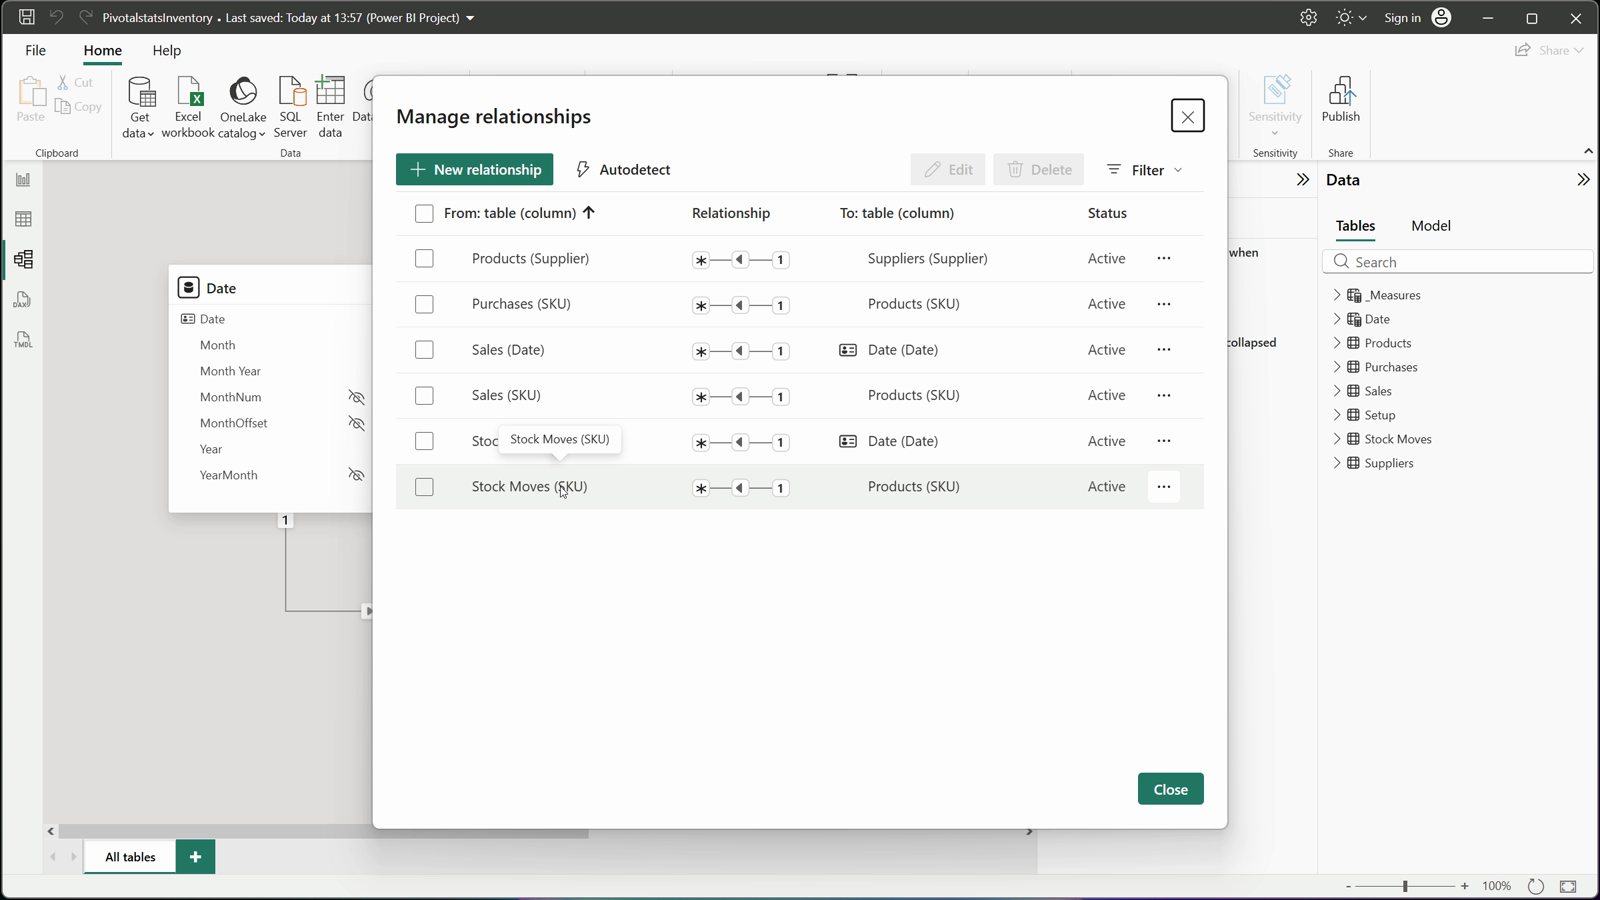
Sales, Purchases, Stock Moves
DAX
Date =

  VAR _s = MAX ( Setup[ReportDate] ) VAR _asof = IF ( ISBLANK ( _s ), TODAY (), _s )

  RETURN

      ADDCOLUMNS (

          CALENDAR ( DATE ( YEAR ( _asof ) - 2, 1, 1 ), EOMONTH ( _asof, 0 ) ),

          "Year", YEAR ( [Date] ),

          "MonthNum", MONTH ( [Date] ),

          "YearMonth", YEAR ( [Date] ) * 100 + MONTH ( [Date] ),

          "Month Year", FORMAT ( [Date], "mmm", "en-US" ) & UNICHAR ( 10 ) & FORMAT ( [Date], "yy", "en-US" ),

          "MonthOffset", ( YEAR ( [Date] ) - YEAR ( _asof ) ) * 12 + MONTH ( [Date] ) - MONTH ( _asof ),

          "Month", DATE ( YEAR ( [Date] ), MONTH ( [Date] ), 1 )

)
Step 07: Stock on hand, on order and daily demand
On Hand sums every Stock Moves row up to the Period End: REMOVEFILTERS on Date plus a filter on the move date turns it into a running total, so a monthly chart shows the stock on each month’s last day. Stock Value multiplies on hand by unit cost per product with SUMX (negative counts count as zero).
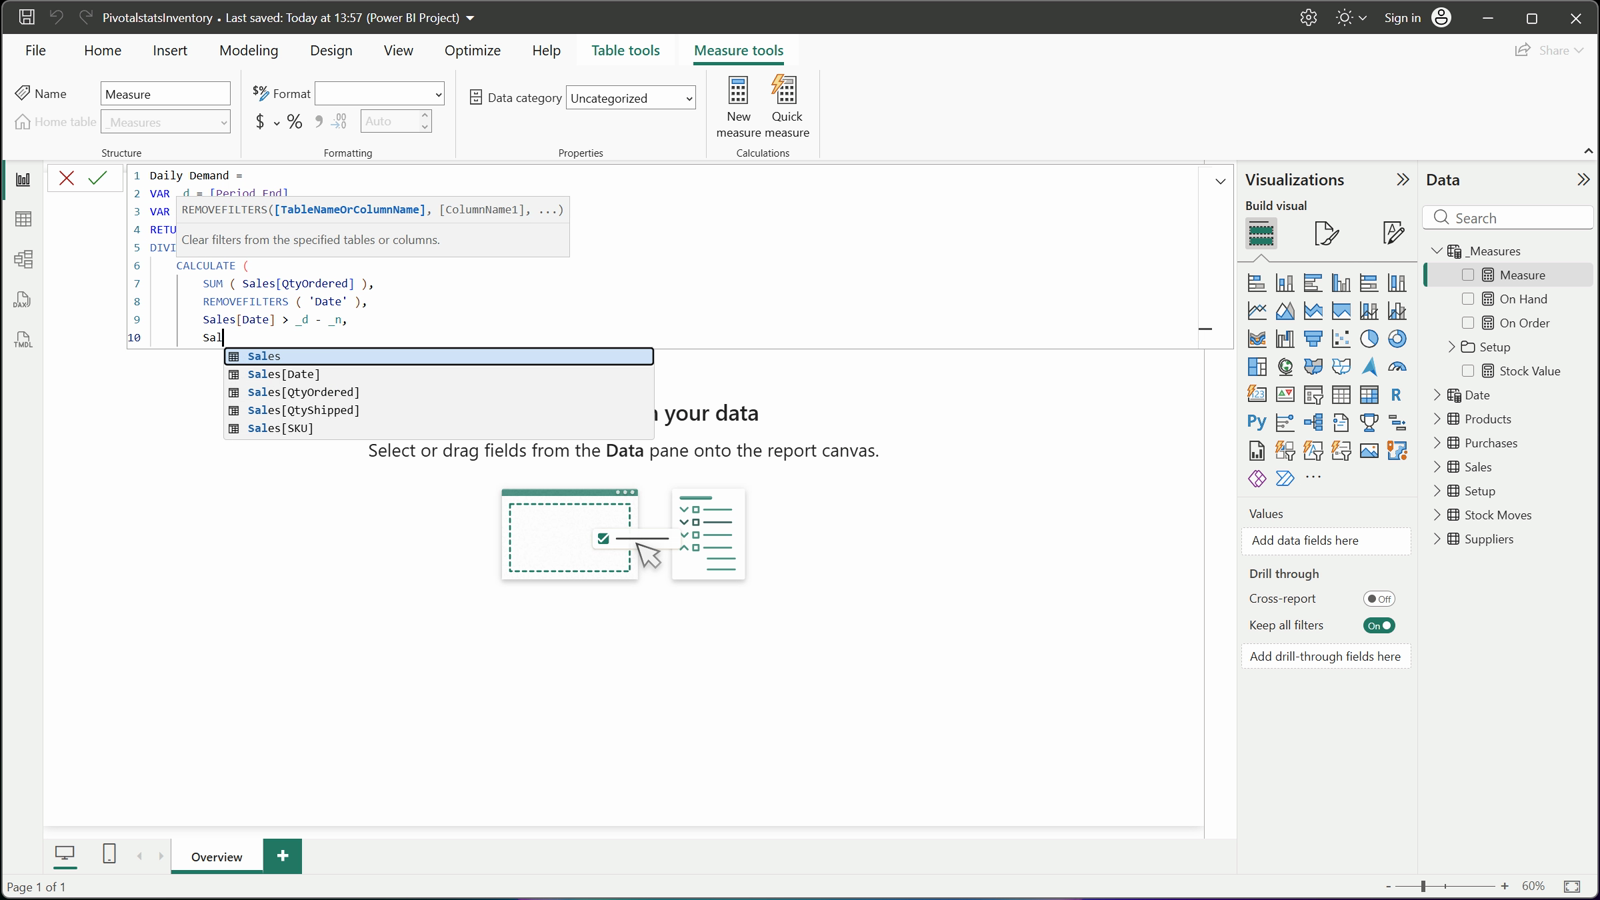
On Order sums the purchase orders placed by the period end that had not arrived by then. Daily Demand is the quantity ordered in the last 90 days / 90; ordered, not shipped, because shipped hides the demand you missed while out of stock.
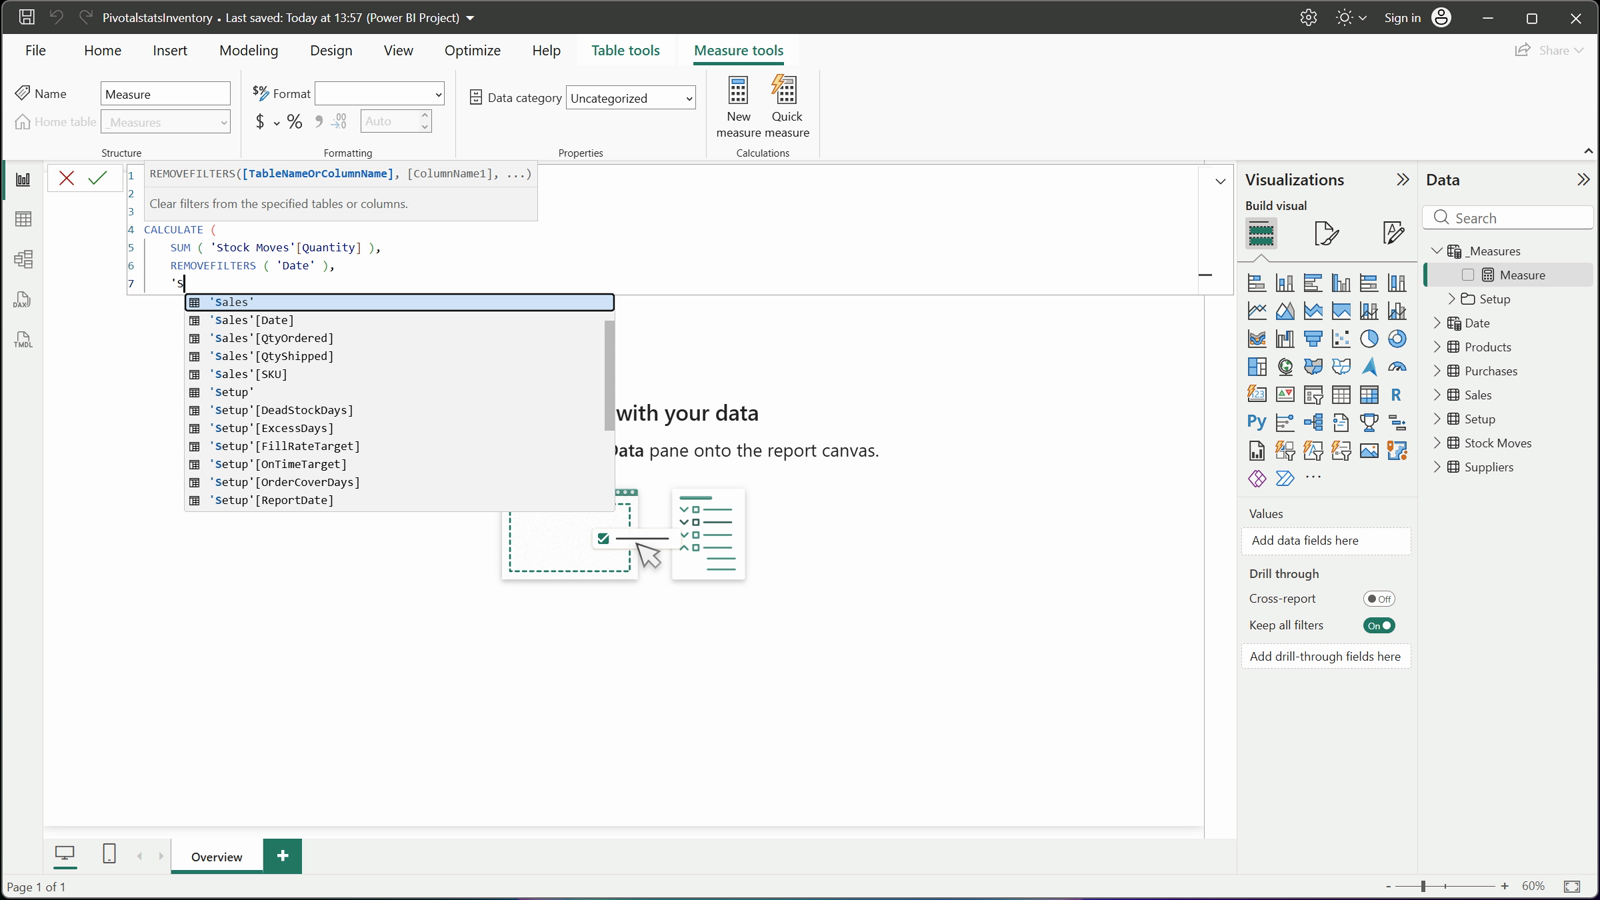
On Hand
Daily Demand
DAX
On Hand =

  VAR _d = [Period End]

  RETURN

      CALCULATE (

          SUM ( 'Stock Moves'[Quantity] ),

          REMOVEFILTERS ( 'Date' ),

          'Stock Moves'[Date] <= _d

) + 0
DAX
Stock Value = SUMX ( Products, MAX ( 0, [On Hand] ) * Products[UnitCost] )
DAX
On Order =

  VAR _d = [Period End]

  RETURN

      CALCULATE (

          SUM ( Purchases[QtyOrdered] ),

          Purchases[OrderDate] <= _d,

          ISBLANK ( Purchases[ReceivedDate] ) || Purchases[ReceivedDate] > _d

) + 0
DAX
Daily Demand =

  VAR _d = [Period End]

  VAR _n = [Demand Days]

  RETURN

      DIVIDE (

          CALCULATE (

              SUM ( Sales[QtyOrdered] ),

              REMOVEFILTERS ( 'Date' ),

              Sales[Date] > _d - _n,

              Sales[Date] <= _d

          ),

          _n

)
Step 08: Reorder point and order quantity from the real lead time
Lead Days Used is the supplier’s actual average lead time over the last 12 months of deliveries, or the promised Lead Time Days when there are none. Reorder Point = Daily Demand x (lead time + safety days), rounded up.
Suggested Qty returns a value only when on hand + on order has fallen to the reorder point, and orders enough for the lead time, the safety days and the order cover days, minus what you have, rounded up to the case pack with CEILING. In the sample, Vacuum Bags (11.5 a day, Coastline’s real 37 days) reorder at 509 units; the promised 28 days would say 404.
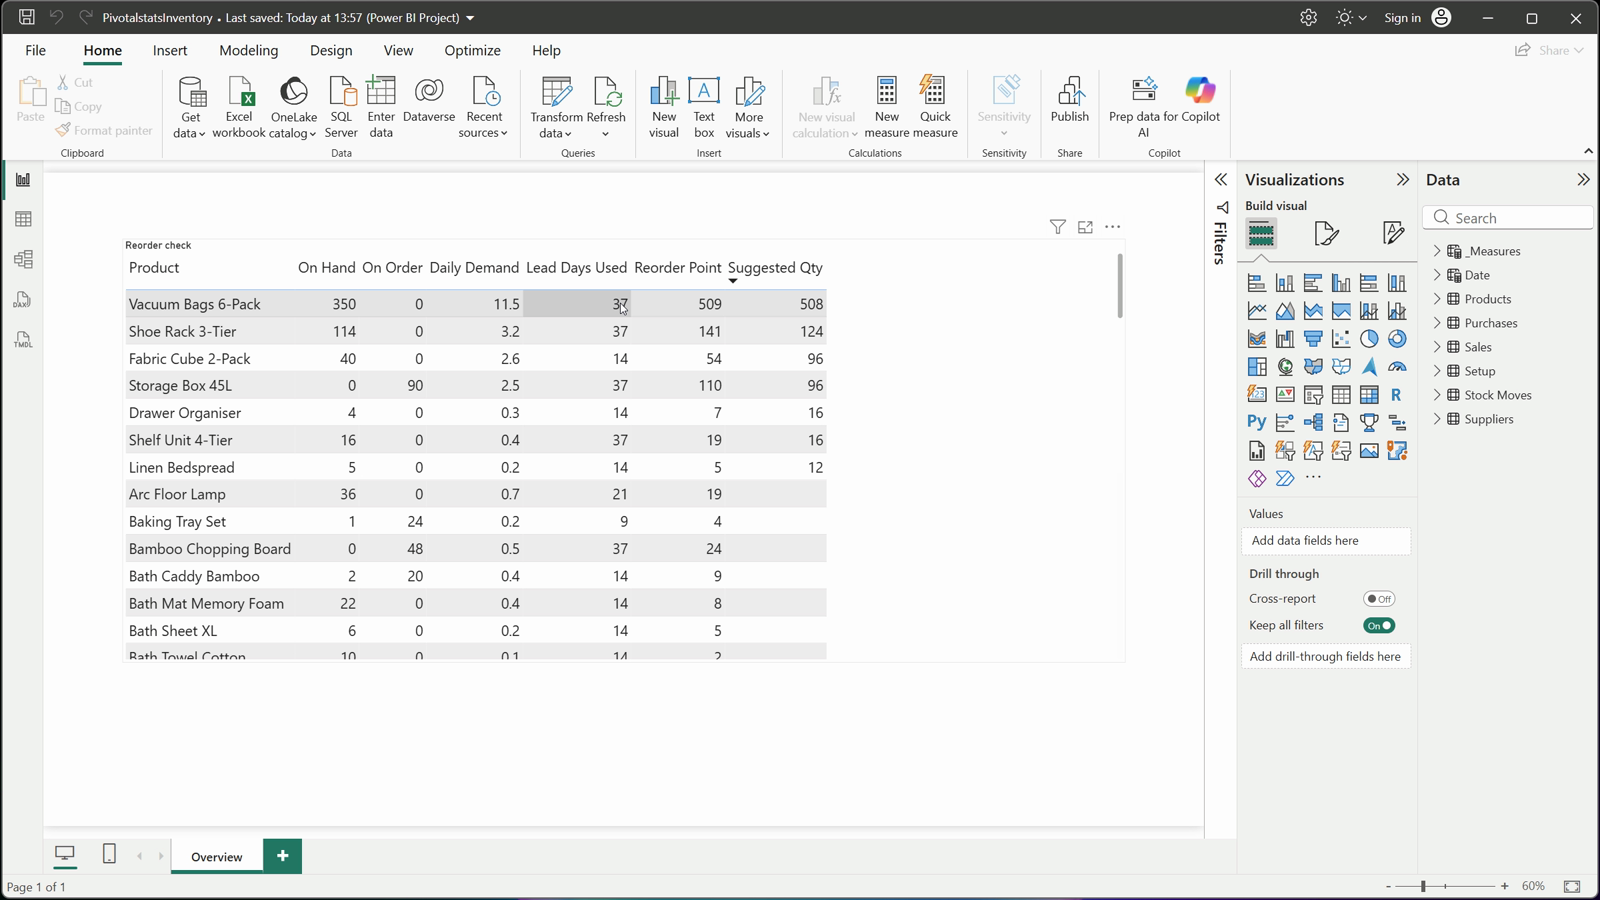
Reorder at 509
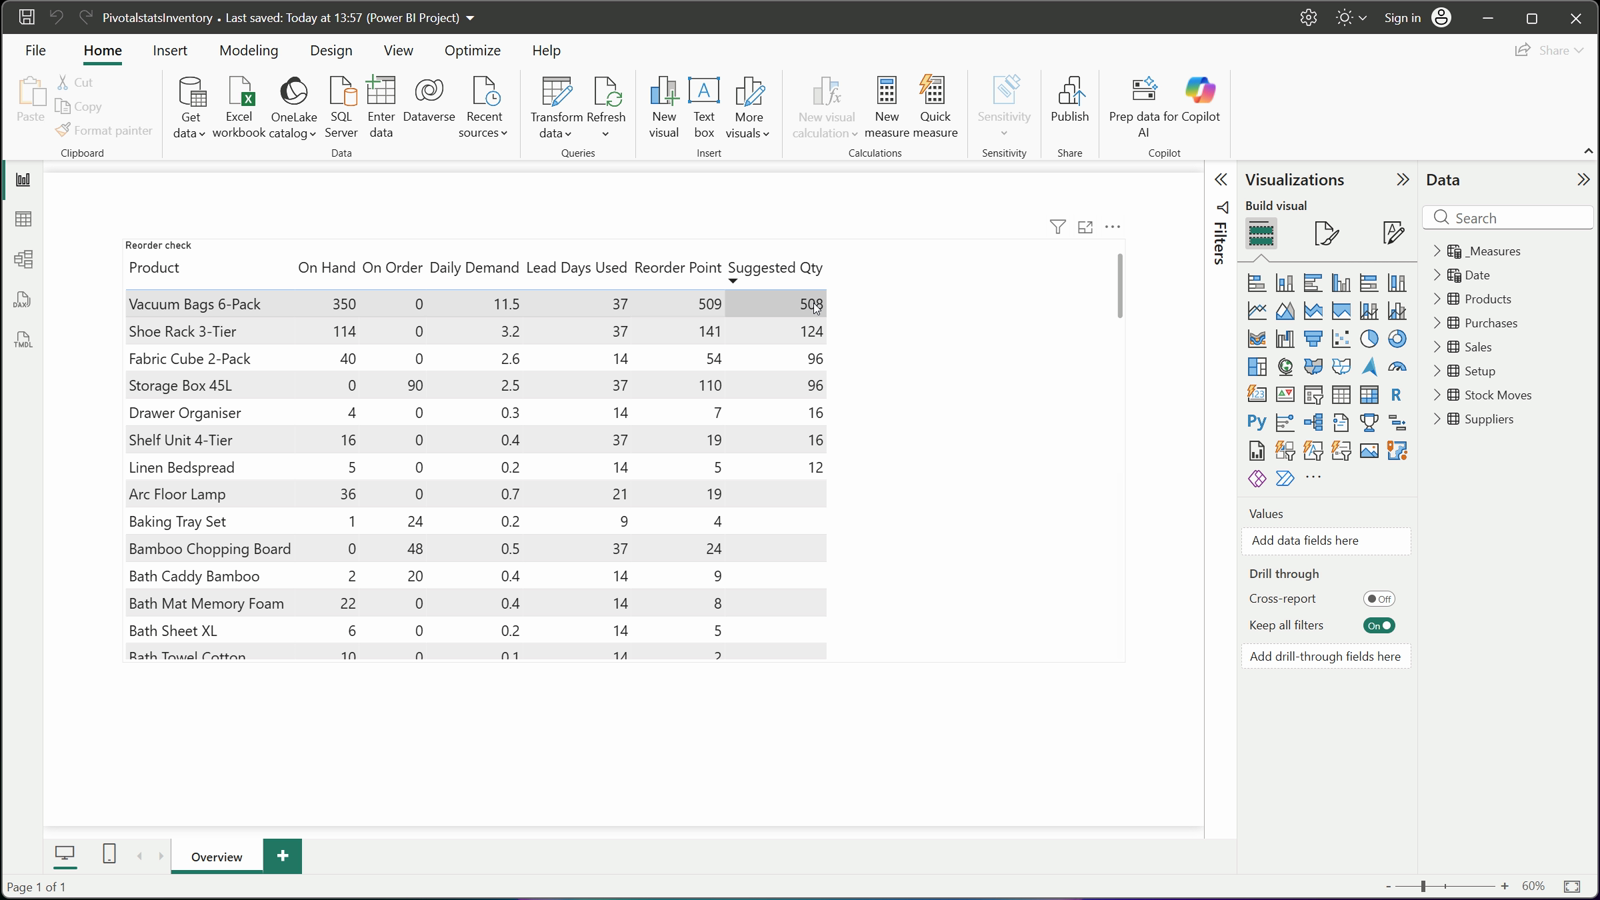
Promised 28 days: 404
DAX
Lead Days Used =

  VAR _d = [Period End]

  VAR _s = SELECTEDVALUE ( Products[Supplier] )

  VAR _actual = CALCULATE ( AVERAGE ( Purchases[LeadDays] ), REMOVEFILTERS ( Products ), Products[Supplier] = _s, NOT ISBLANK ( Purchases[ReceivedDate] ), Purchases[ReceivedDate] > EDATE ( _d, -12 ), Purchases[ReceivedDate] <= _d )

  VAR _promised = LOOKUPVALUE ( Suppliers[LeadTimeDays], Suppliers[Supplier], _s )

RETURN IF ( ISBLANK ( _actual ), _promised, _actual )
DAX
Reorder Point =

  IF (

      HASONEVALUE ( Products[SKU] ),

      ROUNDUP ( [Daily Demand] * ( [Lead Days Used] + [Safety Days] ), 0 )

)
DAX
Suggested Qty =

  VAR _dem = [Daily Demand]

  VAR _lt = [Lead Days Used]

  VAR _pos = [On Hand] + [On Order]

  VAR _rop = ROUNDUP ( _dem * ( _lt + [Safety Days] ), 0 )

  VAR _cp = MAX ( 1, SELECTEDVALUE ( Products[CasePack], 1 ) )

  VAR _need = _dem * ( _lt + [Safety Days] + [Order Cover Days] ) - _pos

  RETURN

IF ( HASONEVALUE ( Products[SKU] ) && _dem > 0 && _pos <= _rop, MAX ( _cp, CEILING ( MAX ( 0, _need ), _cp ) ) )
Step 09: An app-style design you can rebrand
The app window, the dark column, the white cards and the 3D illustration are one 1920 x 1080 background image per page (Canvas background, Fit, 0% transparency), and a theme file sets the fonts and colours and removes visual backgrounds and borders.
The logo is an image visual, the brand name a text box, the tabs are buttons with page navigation, and the Category and Supplier slicers are synced across the pages, so everything a buyer might rebrand is a real object.
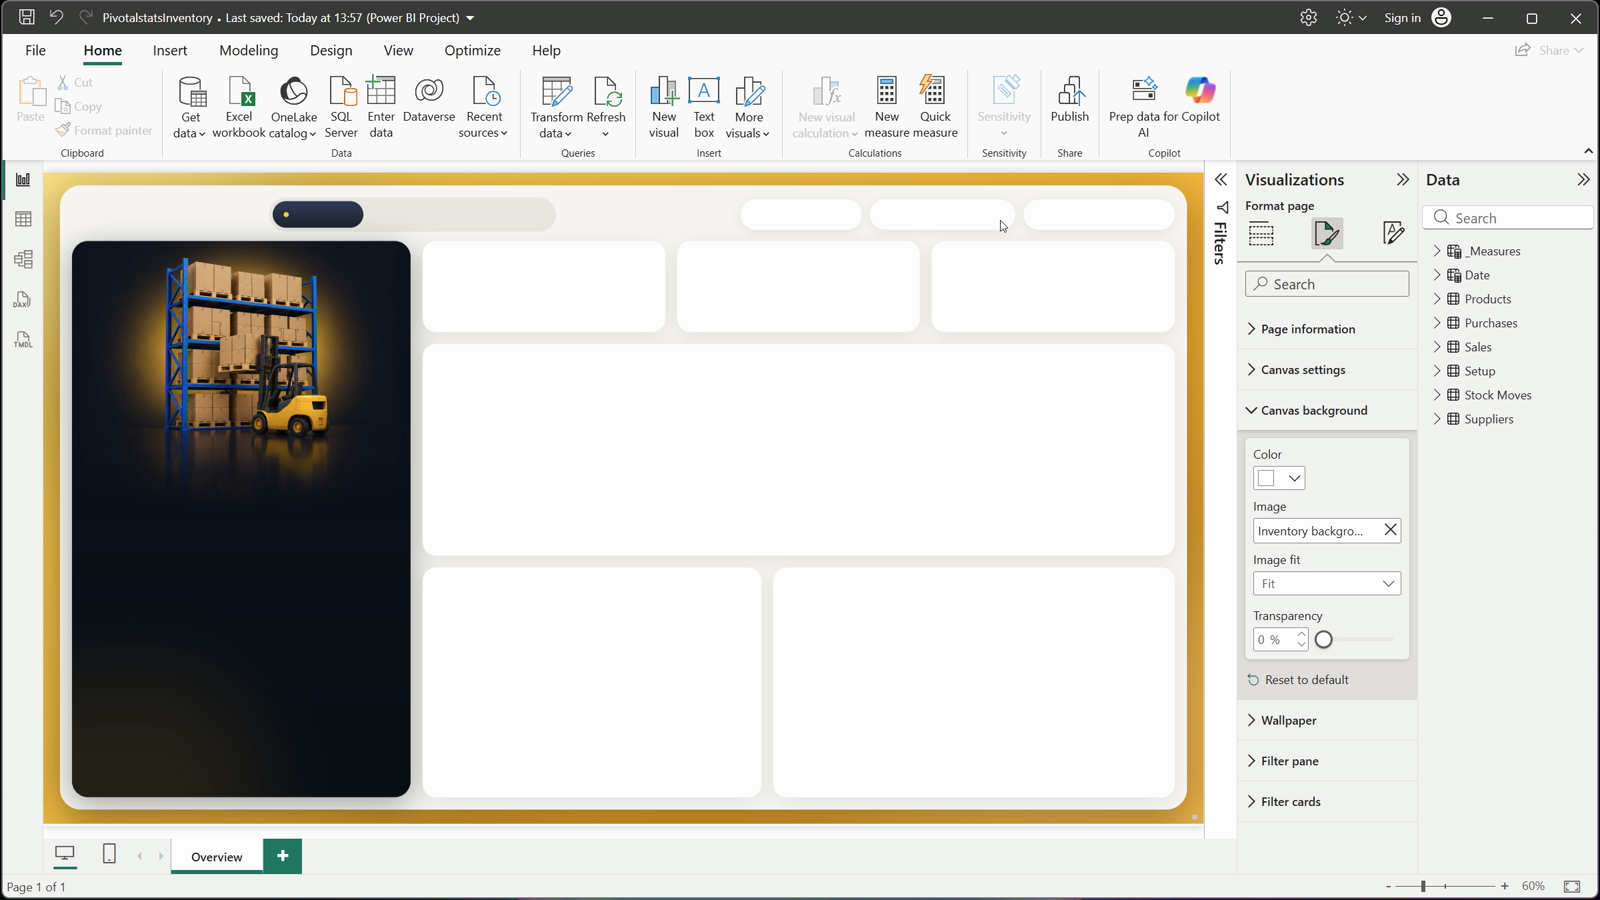
One background image
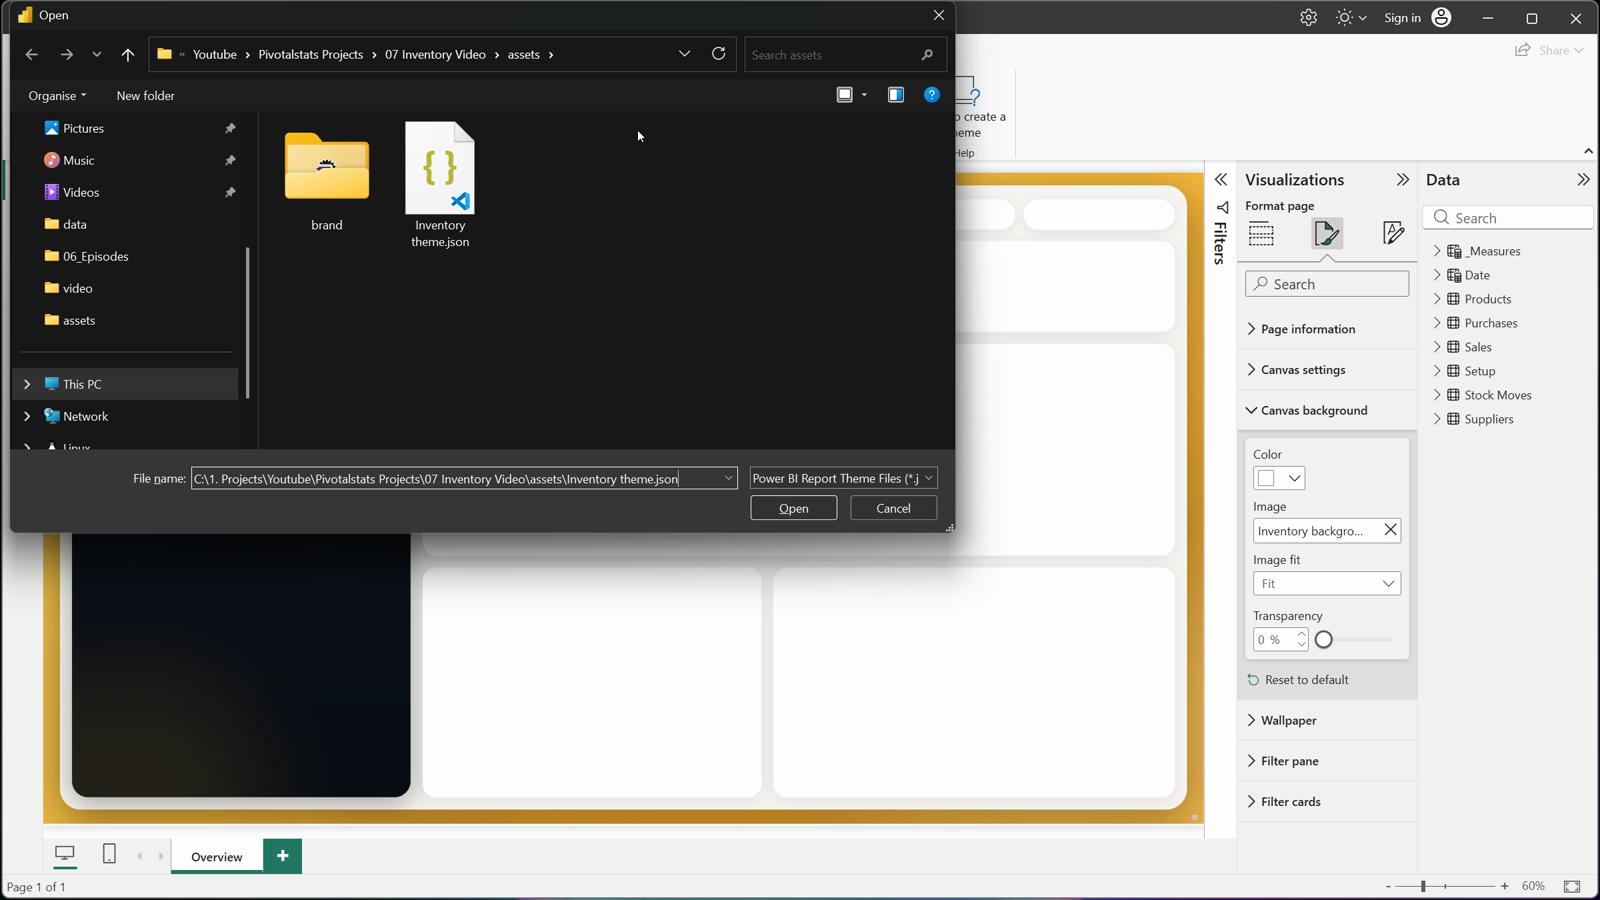
Theme file
Step 10: The hero column and cards are SVG measures
Each hero column and card is one measure that returns an SVG image (data category Image URL) shown in an image visual. The stock column adds a status code to every product once with ADDCOLUMNS, counts each status with FILTER and draws the counts as rows and a share bar.
Each card draws its value as a meter between two limits, with a tick at the target (or the same figure a year ago), and a pill coloured by whether the change is good or bad. The 3D icons are separate image visuals.
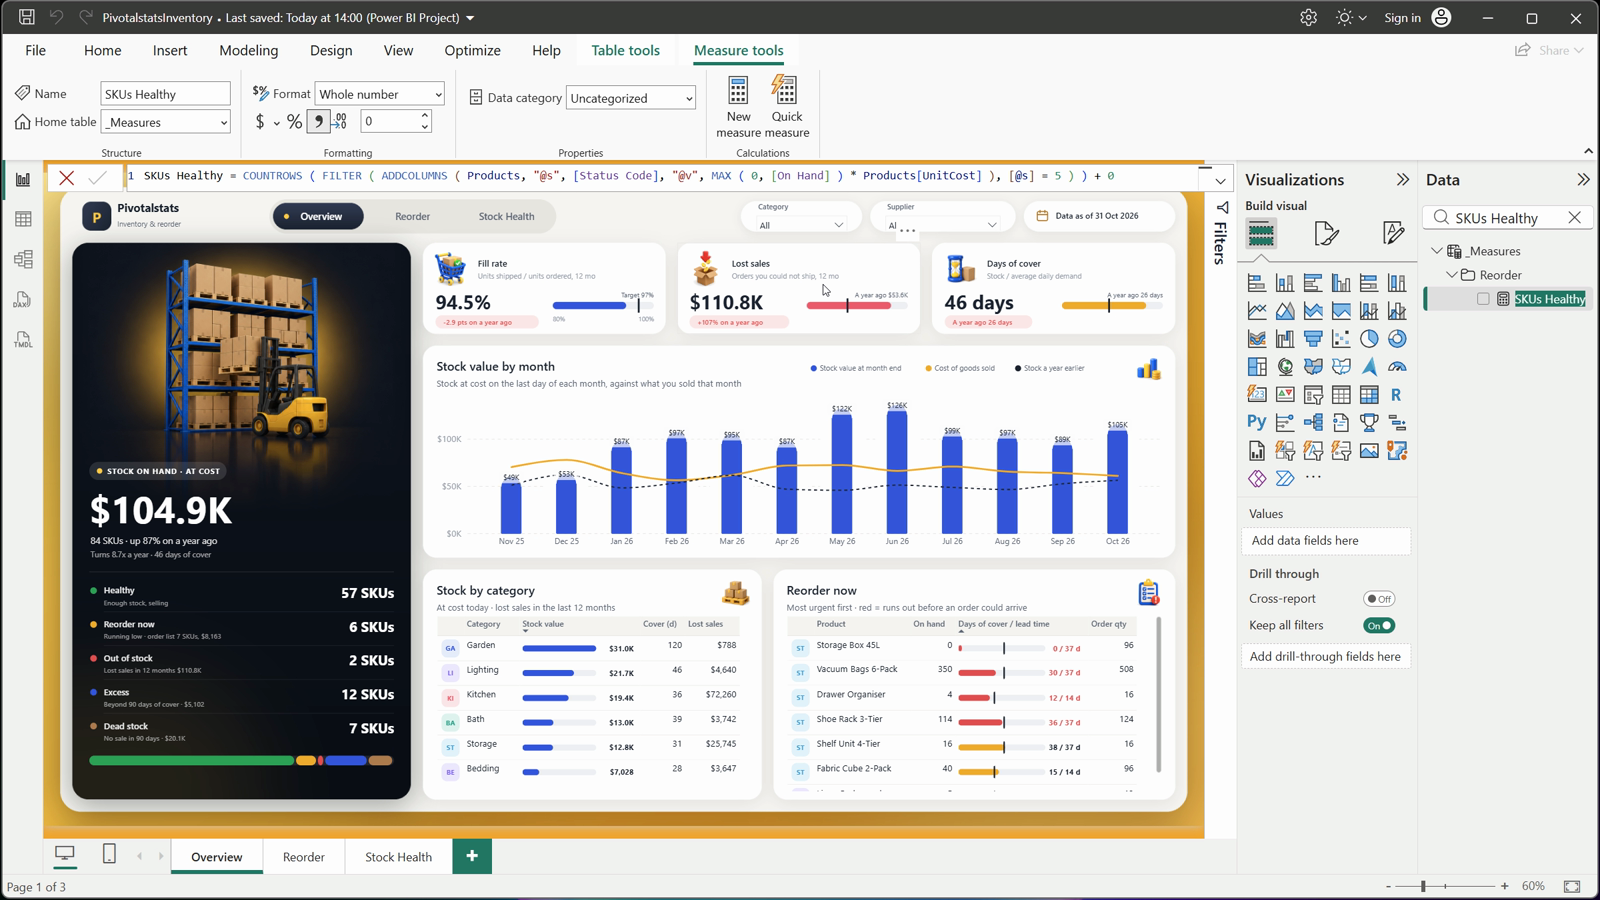
Meter
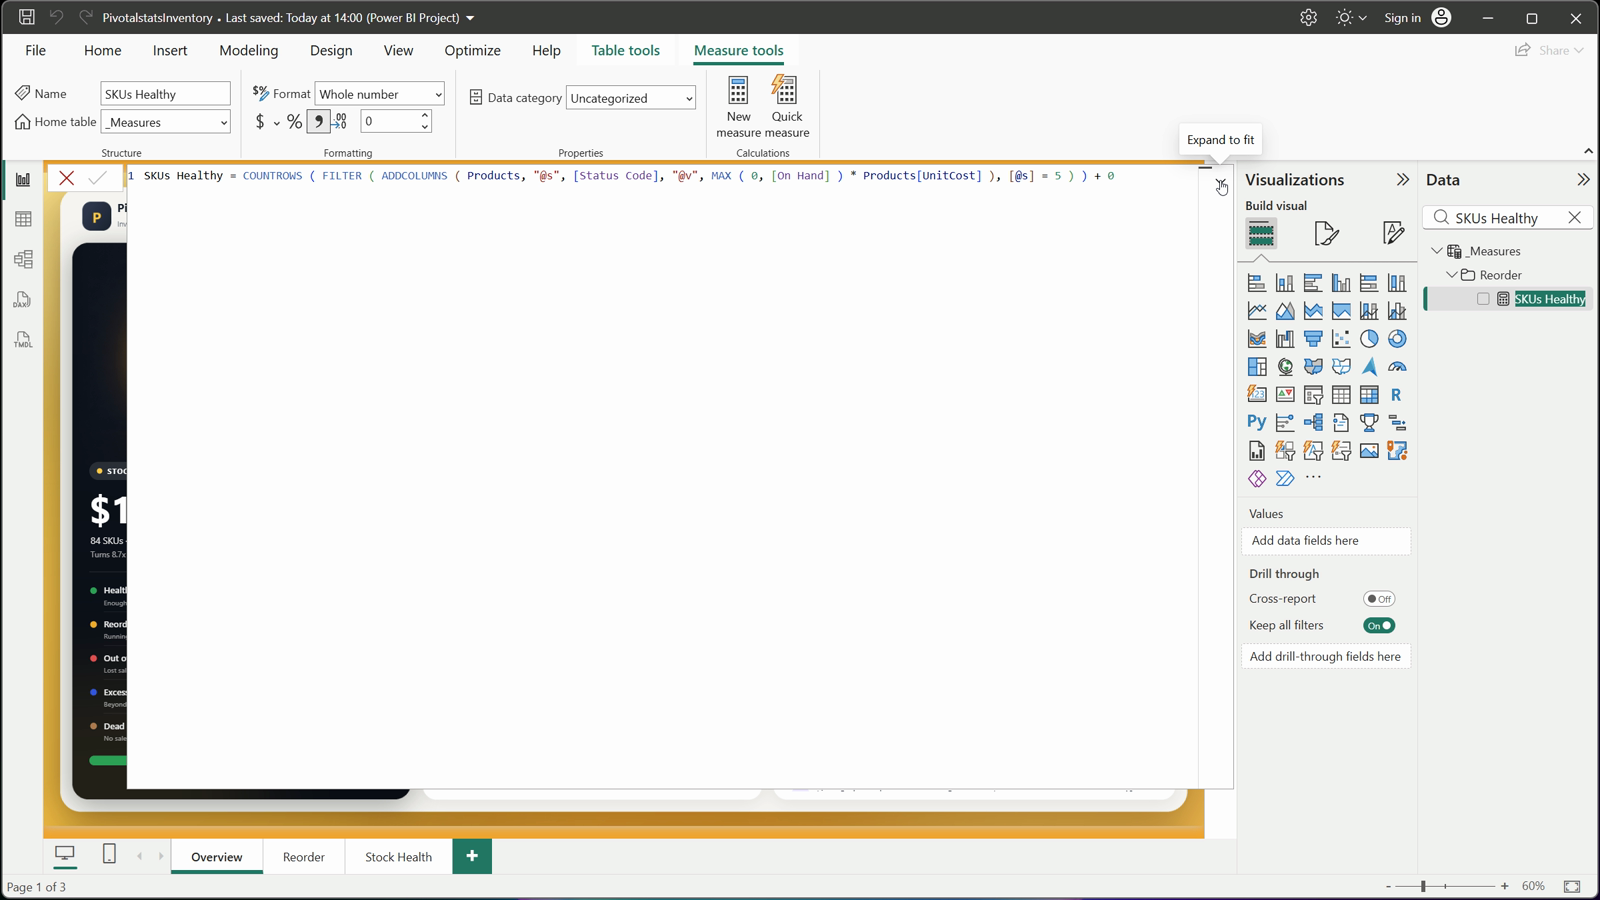
SKUs Healthy
DAX
Card Fill Rate =

  VAR _pill = IF ( ISBLANK ( [Fill Rate YA] ), "No data a year ago", IF ( ( [Fill Rate 12M] - [Fill Rate YA] ) * 100 >= 0, "+", "-" ) & FORMAT ( ABS ( ( [Fill Rate 12M] - [Fill Rate YA] ) * 100 ), "0.0", "en-US" ) & " pts on a year ago" )

  VAR _tone = IF ( ISBLANK ( [Fill Rate YA] ), 0, IF ( ( [Fill Rate 12M] >= [Fill Rate YA] ) = TRUE (), 1, -1 ) )

  VAR _fg = SWITCH ( _tone, 1, "rgb(18,161,80)", -1, "rgb(229,72,77)", 2, "rgb(183,121,31)", "rgb(94,102,120)" )

  VAR _bg = SWITCH ( _tone, 1, "rgb(227,247,236)", -1, "rgb(253,232,232)", 2, "rgb(254,243,217)", "rgb(238,240,243)" )

  VAR _pw = 26 + LEN ( _pill ) * 6.6

  VAR _v = [Fill Rate 12M]

  VAR _r = [Fill Rate Target]

  VAR _lo = 0.8

  VAR _hi = 1

  VAR _sc = DIVIDE ( 167, _hi - _lo )

  VAR _vx = 214 + MAX ( 0, MIN ( _hi, _v ) - _lo ) * _sc

  VAR _rx = 214 + MAX ( 0, MIN ( _hi, _r ) - _lo ) * _sc

  RETURN

      "data:image/svg+xml;utf8,<svg xmlns='http://www.w3.org/2000/svg' width='401' height='150' viewBox='0 0 401 150'>"

          & "<text x='90' y='40' font-family='Segoe UI' font-size='14.5' font-weight='600' fill='rgb(29,36,51)'>Fill rate</text>"

          & "<text x='90' y='60' font-family='Segoe UI' font-size='12' fill='rgb(154,160,173)'>Units shipped / units ordered, 12 mo</text>"

          & "<text x='20' y='110' font-family='Segoe UI' font-size='32' font-weight='700' fill='rgb(29,36,51)'>" & FORMAT ( [Fill Rate 12M] * 100, "0.0", "en-US" ) & "%25" & "</text>"

          & "<rect x='20' y='120' width='" & FORMAT ( _pw, "0", "en-US" ) & "' height='22' rx='11' fill='" & _bg & "'/>"

          & "<text x='33' y='135.5' font-family='Segoe UI' font-size='11.5' font-weight='600' fill='" & _fg & "'>" & _pill & "</text>"

          & "<text x='381' y='90' text-anchor='end' font-family='Segoe UI' font-size='11' fill='rgb(94,102,120)'>" & "Target " & FORMAT ( [Fill Rate Target] * 100, "0", "en-US" ) & "%25" & "</text>"

          & "<rect x='214' y='98' width='167' height='12' rx='6' fill='rgb(238,240,243)'/>"

          & IF ( NOT ISBLANK ( _v ), "<rect x='214' y='98' width='" & FORMAT ( MAX ( 12, _vx - 214 ), "0.0", "en-US" ) & "' height='12' rx='6' fill='rgb(49,87,224)'/>", "" )

          & IF ( NOT ISBLANK ( _r ), "<rect x='" & FORMAT ( _rx - 1.5, "0.0", "en-US" ) & "' y='92' width='3' height='24' rx='1.5' fill='rgb(29,36,51)'/>", "" )

          & "<text x='214' y='130' font-family='Segoe UI' font-size='10.5' fill='rgb(154,160,173)'>" & "80%25" & "</text>"

          & "<text x='381' y='130' text-anchor='end' font-family='Segoe UI' font-size='10.5' fill='rgb(154,160,173)'>" & "100%25" & "</text>"

& "</svg>"
Step 11: Stock value by month, by category, and what to reorder
The monthly chart is a standard combo chart: rounded stock-value columns (white columns with error bars on top) and the cost of goods sold and the stock a year earlier as lines on the same axis. In the sample, stock peaked at $126K in June while monthly cost of goods sold stayed between $56K and $78K.
Stock by category uses SVG measures for the chip and the value bar. The reorder list shows only products with a suggested quantity, with a bar for days of cover against the lead time (red = runs out before an order could arrive), sorted by a hidden data-k key.
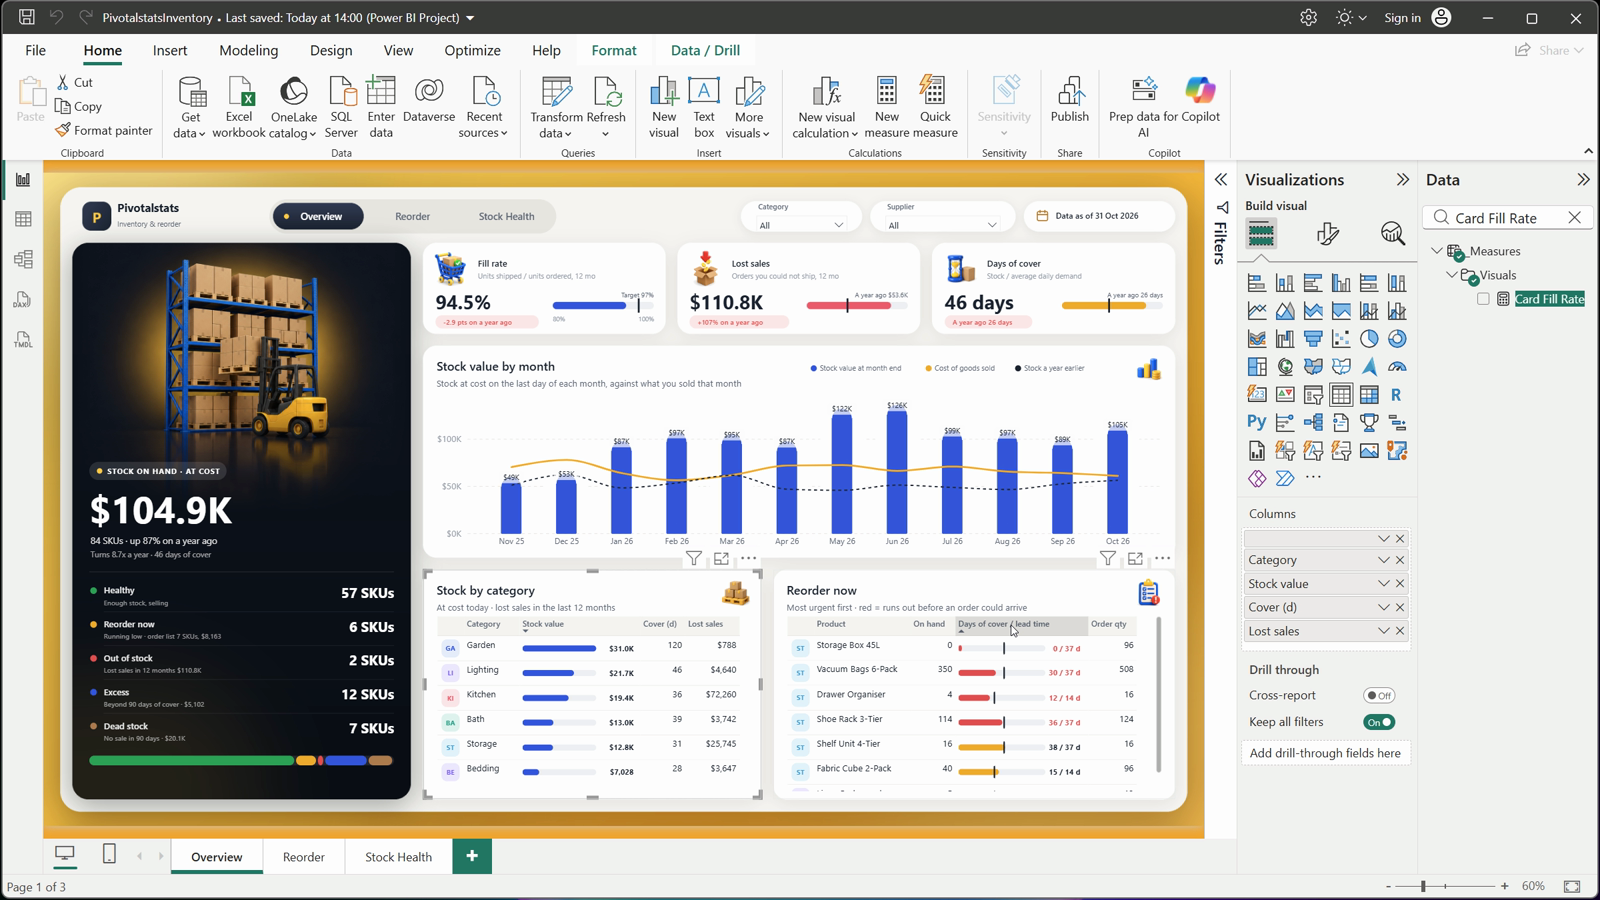
Red = runs out first
Rounded columns
DAX
Mo Stock Value = IF ( HASONEVALUE ( 'Date'[YearMonth] ) && NOT ISBLANK ( MAX ( 'Date'[Date] ) ) && MAX ( 'Date'[MonthOffset] ) >= -11 && MAX ( 'Date'[MonthOffset] ) <= 0, [Stock Value] )
DAX
Cover Bar =

  VAR _q = [Suggested Qty]

  VAR _c = [Days of Cover] + 0

  VAR _lt = [Lead Days Used]

  VAR _sd = _lt + [Safety Days]

  VAR _top = MAX ( _sd * 1.6, 10 )

  VAR _col = IF ( _c < _lt, "rgb(229,72,77)", IF ( _c < _sd, "rgb(242,169,0)", "rgb(20,163,139)" ) )

  VAR _x = MIN ( 1, DIVIDE ( _c, _top ) ) * 174

  VAR _lx = DIVIDE ( _lt, _top ) * 174

  RETURN

      IF ( NOT ISBLANK ( _q ),

          "data:image/svg+xml;utf8,<svg xmlns='http://www.w3.org/2000/svg' data-k='" & FORMAT ( MAX ( 0, _c - _lt + 500 ), "0000", "en-US" ) & "' width='236' height='32'>"

              & "<rect x='0' y='11' width='174' height='10' rx='5' fill='rgb(238,240,243)'/>"

              & "<rect x='0' y='11' width='" & FORMAT ( MAX ( 6, _x ), "0.0", "en-US" ) & "' height='10' rx='5' fill='" & _col & "'/>"

              & "<rect x='" & FORMAT ( _lx - 1.2, "0.0", "en-US" ) & "' y='6' width='2.5' height='20' rx='1.2' fill='rgb(29,36,51)'/>"

              & "<text x='232' y='20.5' text-anchor='end' font-family='Segoe UI' font-size='12.5' font-weight='700' fill='" & IF ( _c < _lt, "rgb(229,72,77)", "rgb(29,36,51)" ) & "'>"

& FORMAT ( _c, "0", "en-US" ) & " / " & FORMAT ( _lt, "0", "en-US" ) & " d</text></svg>" )
Step 12: Purchase orders, the reorder list and the supplier scorecard
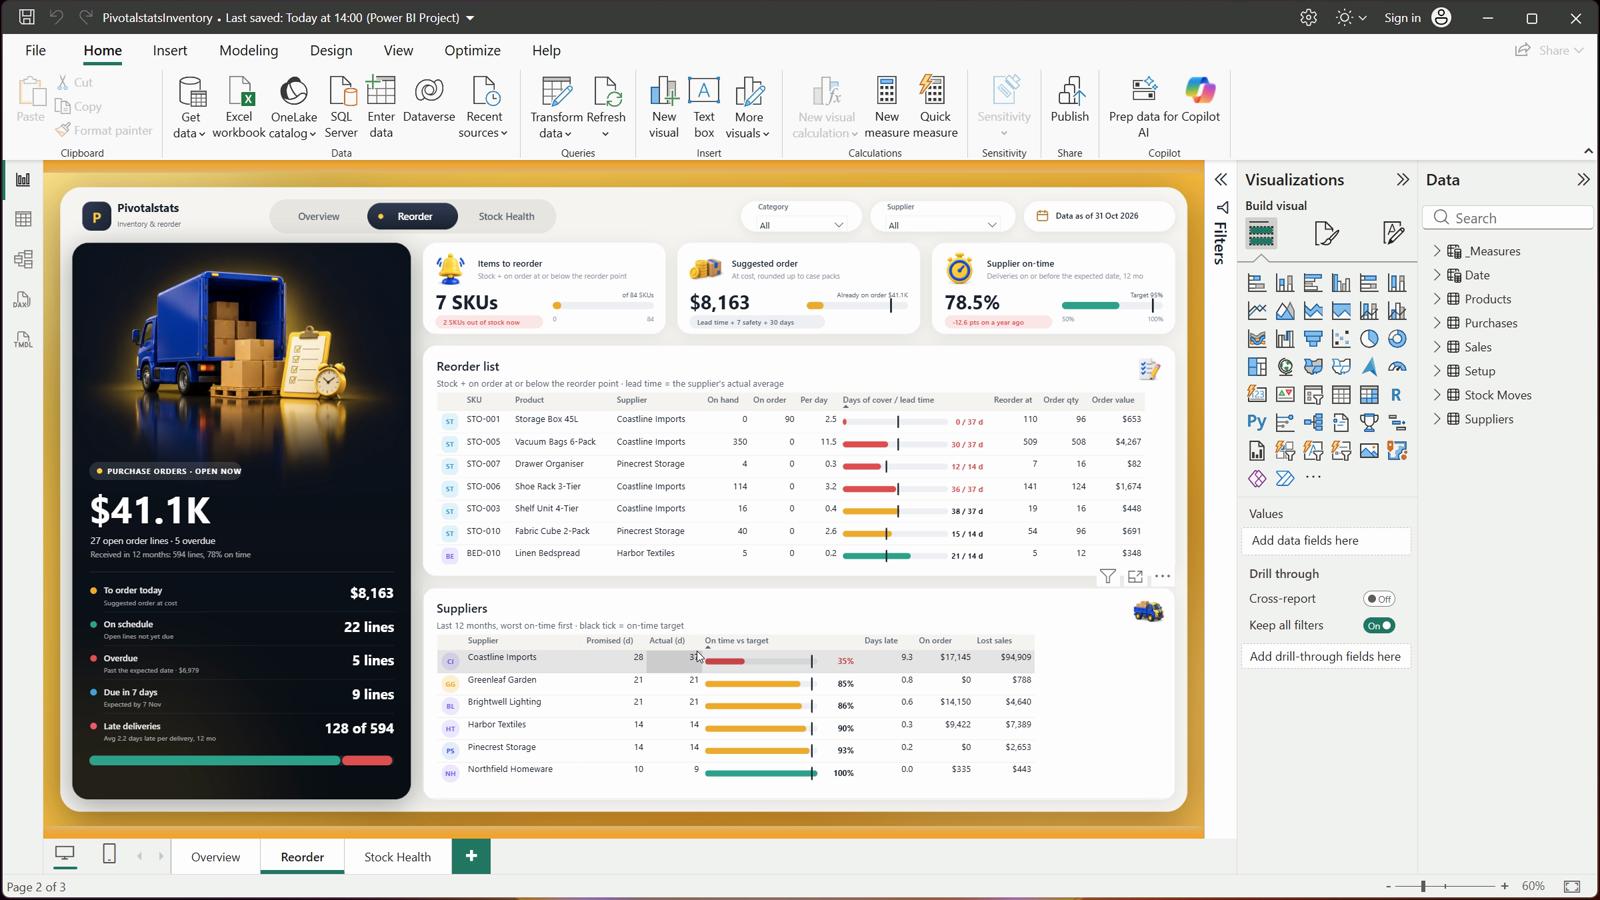
The Reorder page shows the open purchase orders (on schedule, overdue, due in 7 days), the full reorder list with supplier, on hand, on order, daily demand, reorder point, order quantity and value, and a scorecard per supplier.
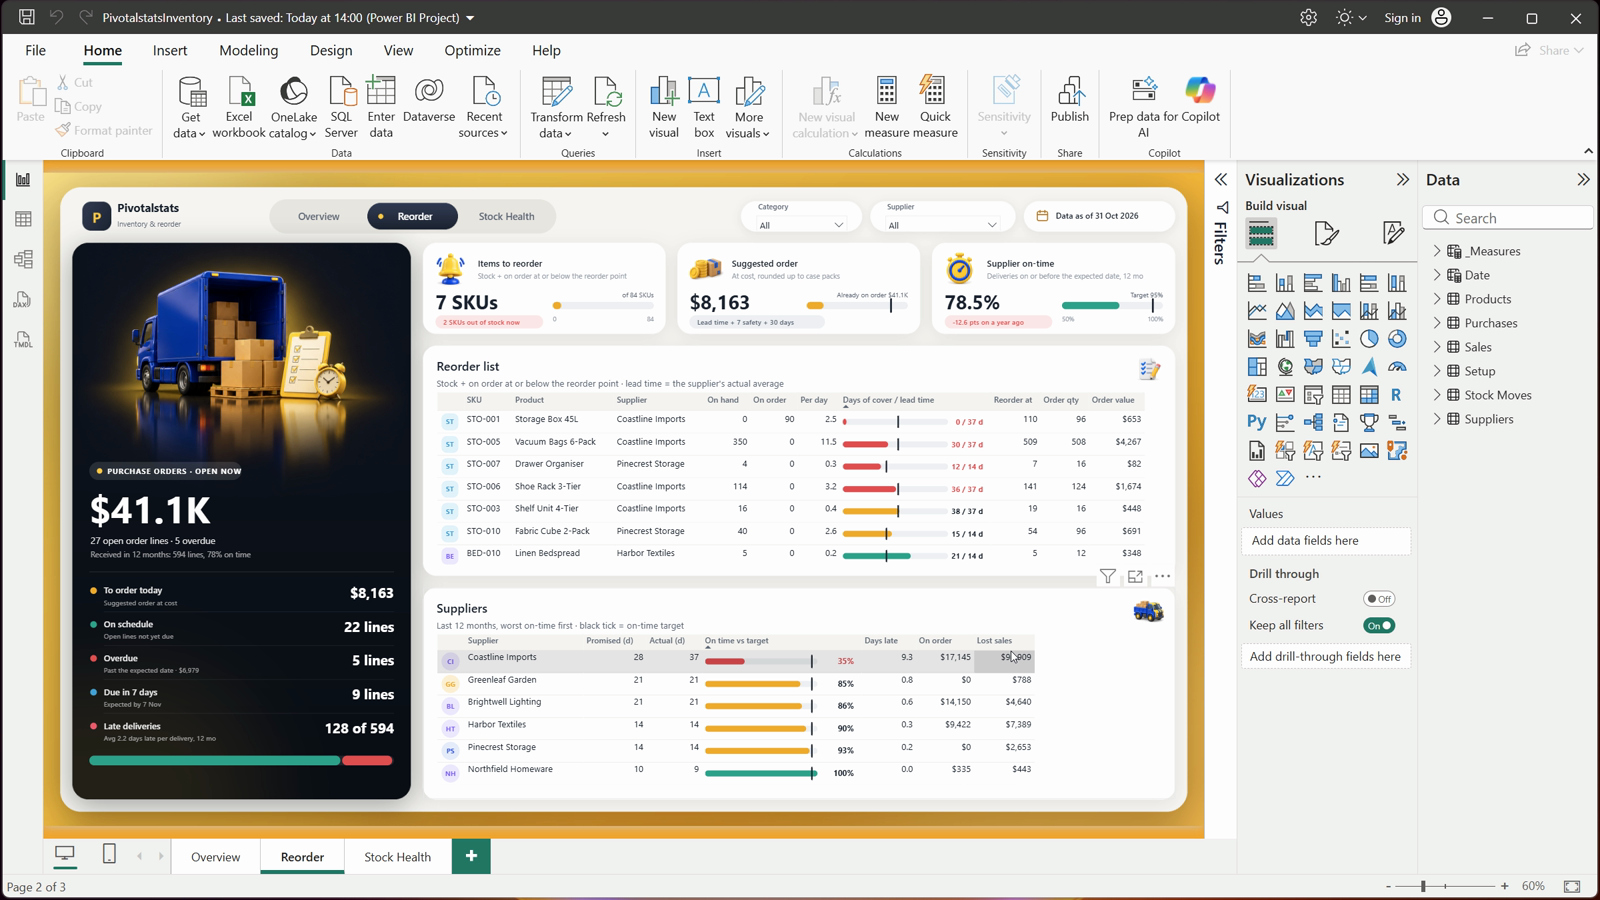
The scorecard compares the promised lead time with the actual one, shows the on-time rate against a target, the average days late, what is on order and the lost sales on each supplier’s products. In the sample, Coastline Imports takes 37 days instead of 28 and delivers 35% on time.
Coastline Imports
$94.9K of lost sales
DAX
On Time 12M = DIVIDE ( [POs Received 12M] - [Late POs 12M], [POs Received 12M] )
DAX
Avg Days Late 12M = VAR _d = [Period End] RETURN CALCULATE ( AVERAGEX ( Purchases, MAX ( 0, Purchases[DaysLate] ) ), NOT ISBLANK ( Purchases[ReceivedDate] ), Purchases[ReceivedDate] > EDATE ( _d, -12 ), Purchases[ReceivedDate] <= _d )
Step 13: ABC analysis, dead and excess stock
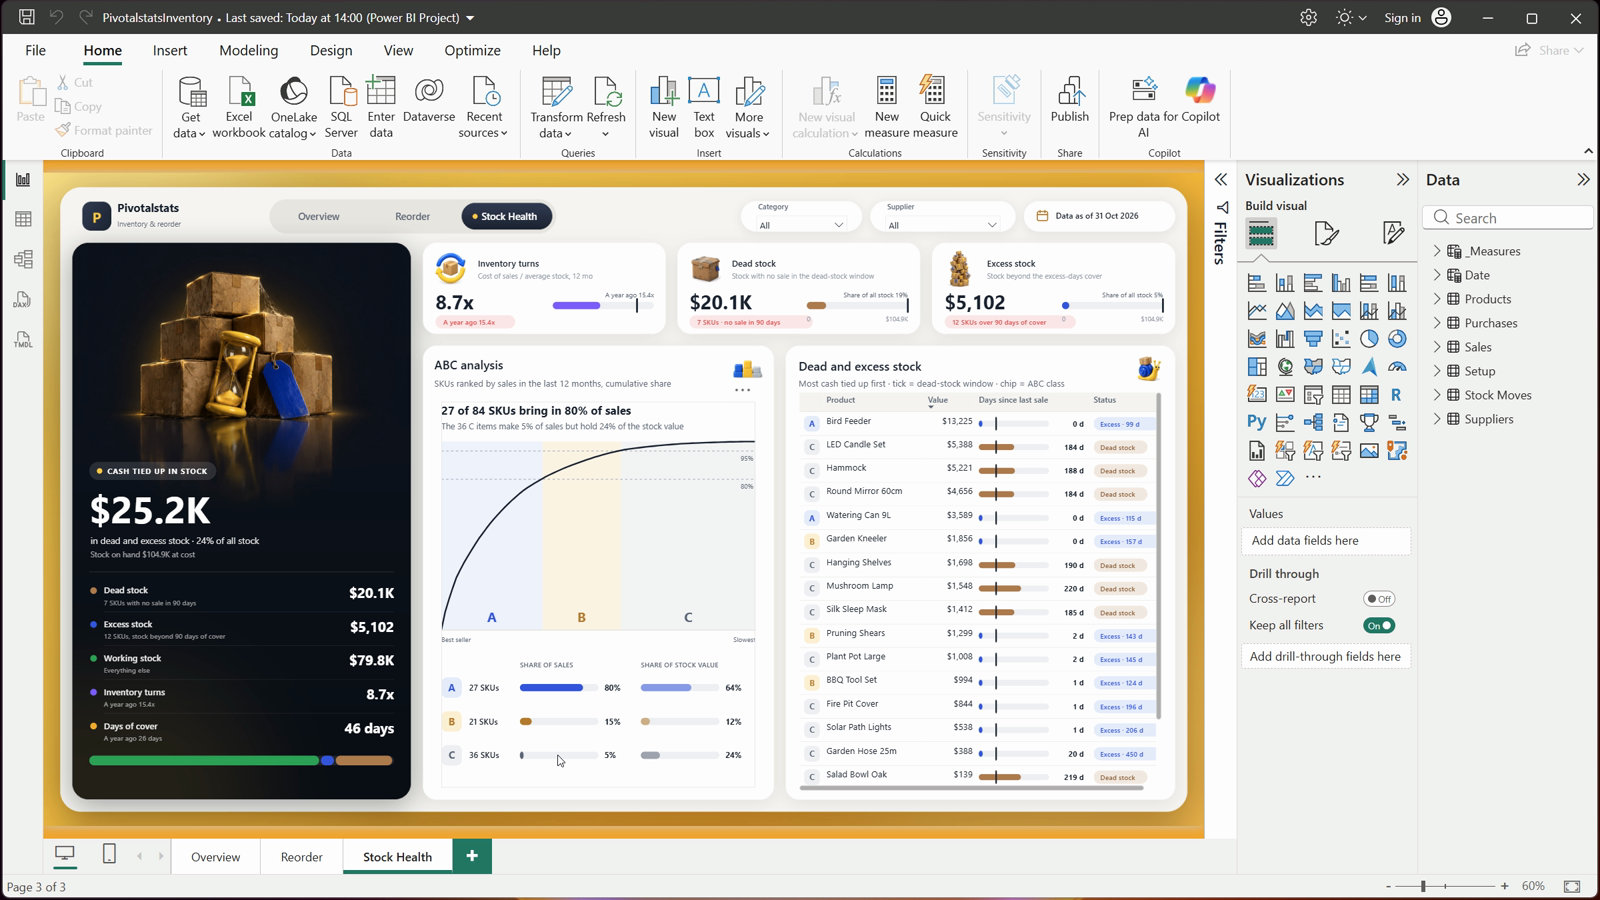
The ABC analysis is one SVG measure: products ranked by 12-month sales, a cumulative curve, A up to 80% of sales, B up to 95%, C the rest, and each class’s share of sales against its share of stock value. In the sample, 27 products make 80% of sales and the 36 C items hold 24% of the stock for 5% of the sales.
Dead stock has had no sale in the dead-stock window (90 days); excess stock is the part beyond the excess-days cover. Their total is the cash tied up.
C items: 5% of sales
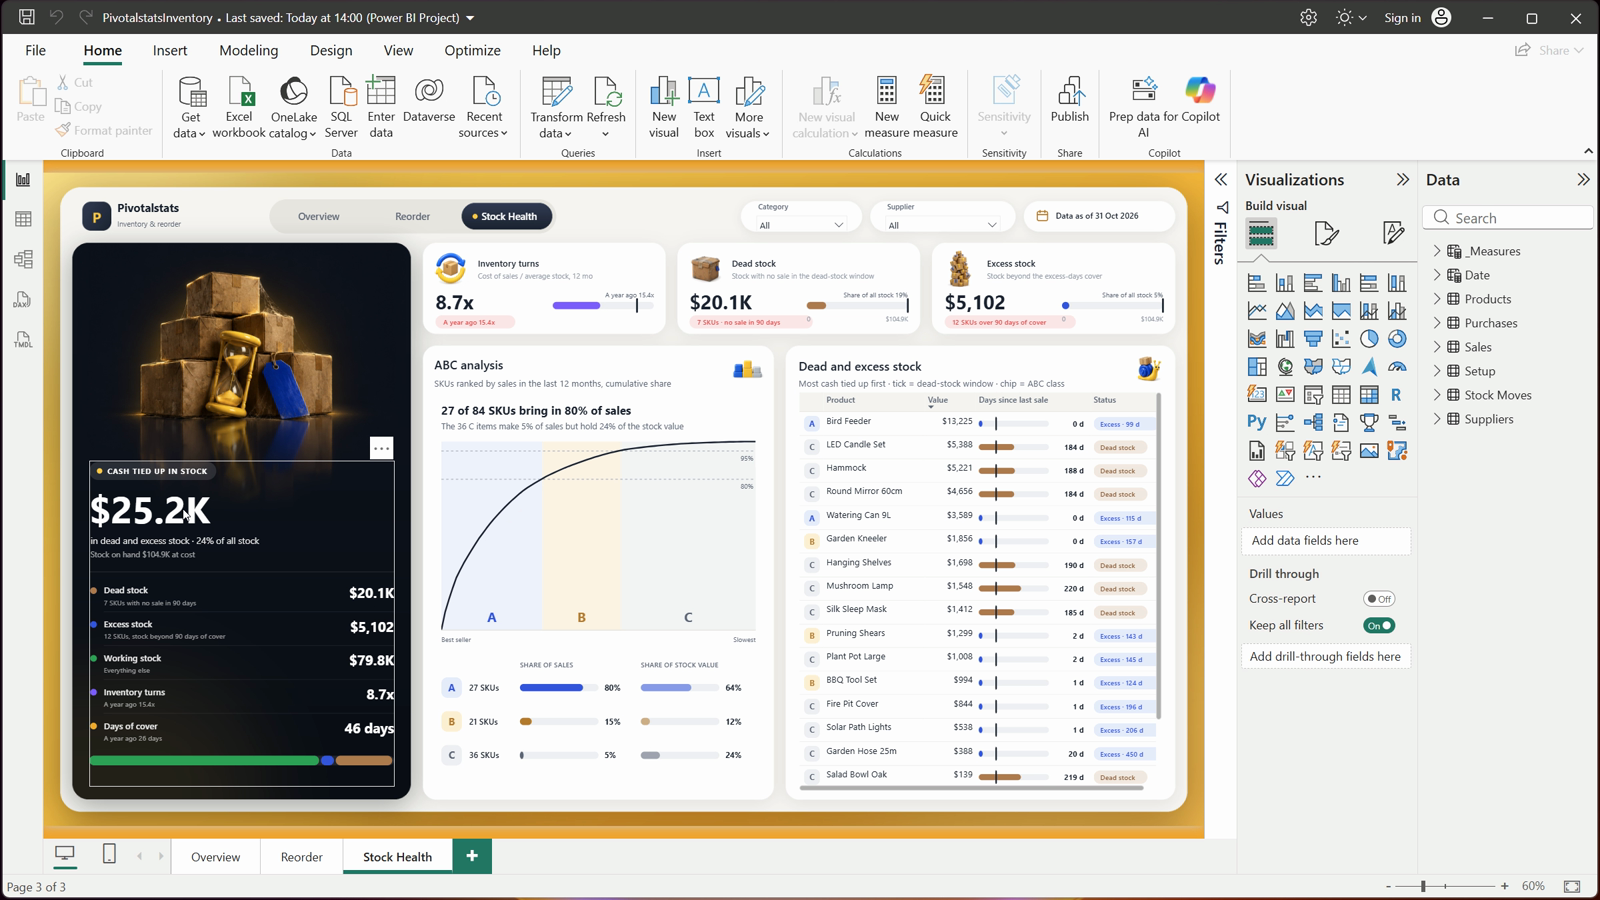
Cash tied up $25.2K
DAX
ABC Class =

  VAR _sku = SELECTEDVALUE ( Products[SKU] )

  VAR _t = ADDCOLUMNS ( ALLSELECTED ( Products ), "@r", [Revenue 12M] + 0 )

  VAR _me = MAXX ( FILTER ( _t, Products[SKU] = _sku ), [@r] )

  VAR _before = DIVIDE ( SUMX ( FILTER ( _t, [@r] > _me ), [@r] ), SUMX ( _t, [@r] ) )

RETURN IF ( NOT ISBLANK ( _sku ), IF ( _before < 0.8, "A", IF ( _before < 0.95, "B", "C" ) ) )
DAX
Excess Stock Value = SUMX ( Products, IF ( [Status Code] = 4, MAX ( 0, [On Hand] - [Daily Demand] * [Excess Days] ) * Products[UnitCost] ) ) + 0
Step 14: Update it and find the cause
To update the report, add new rows to the workbook’s tables (or fill in the received date of a purchase order), save it and click Refresh. The Category and Supplier slicers then narrow every page: in the sample, Coastline Imports’ products ship only 85% of what is ordered, and ten of the fourteen garden products hold excess stock.
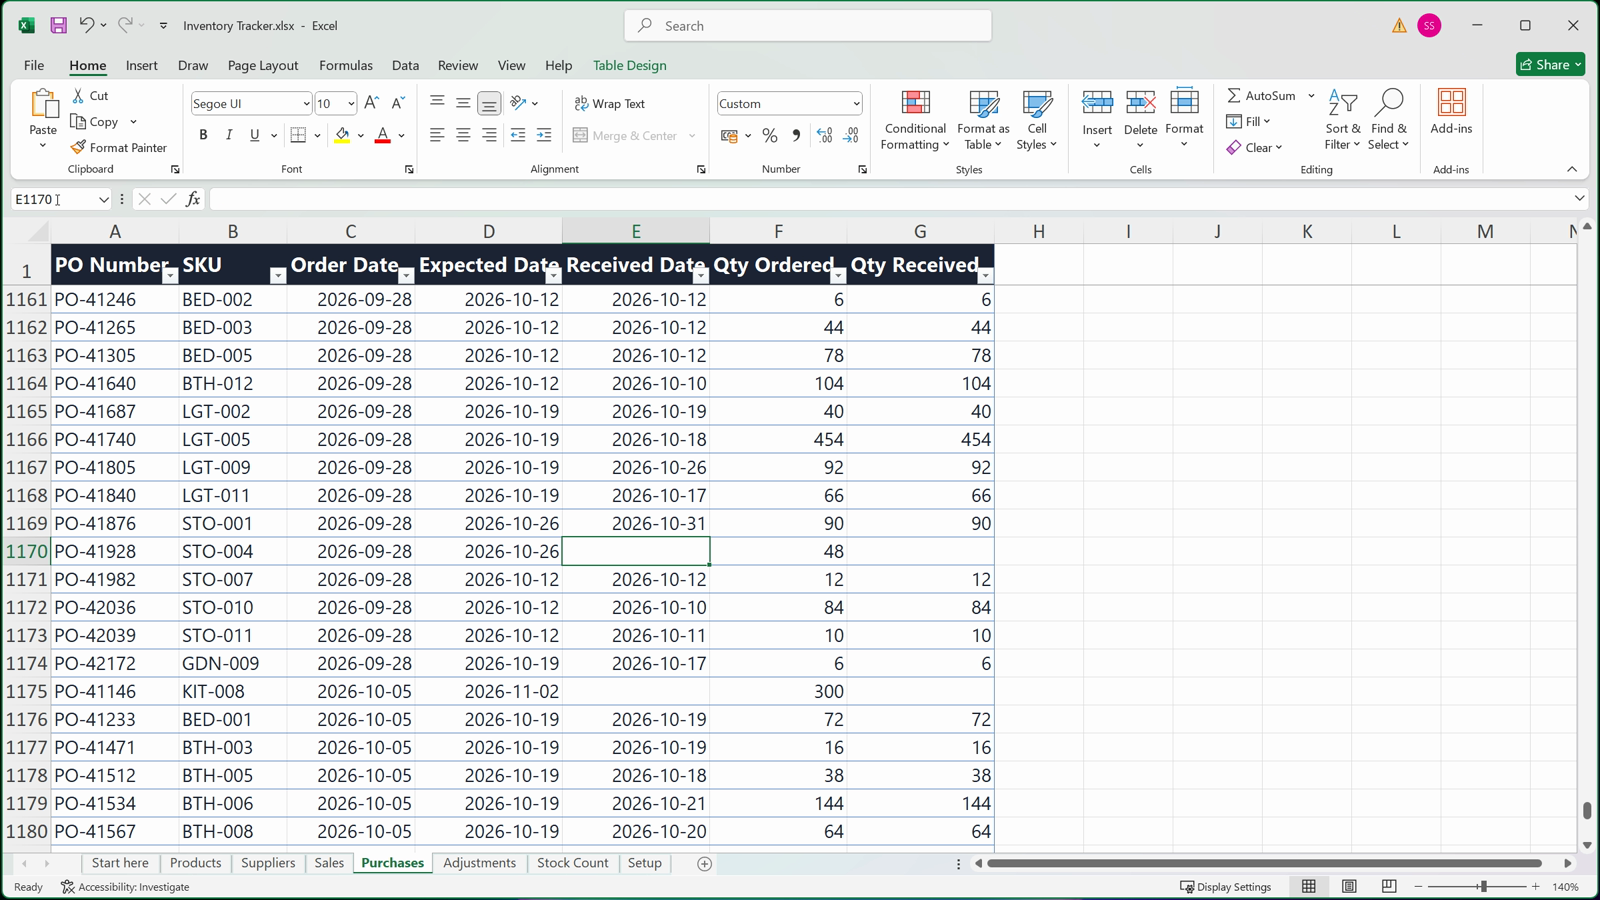
PO-41876 received
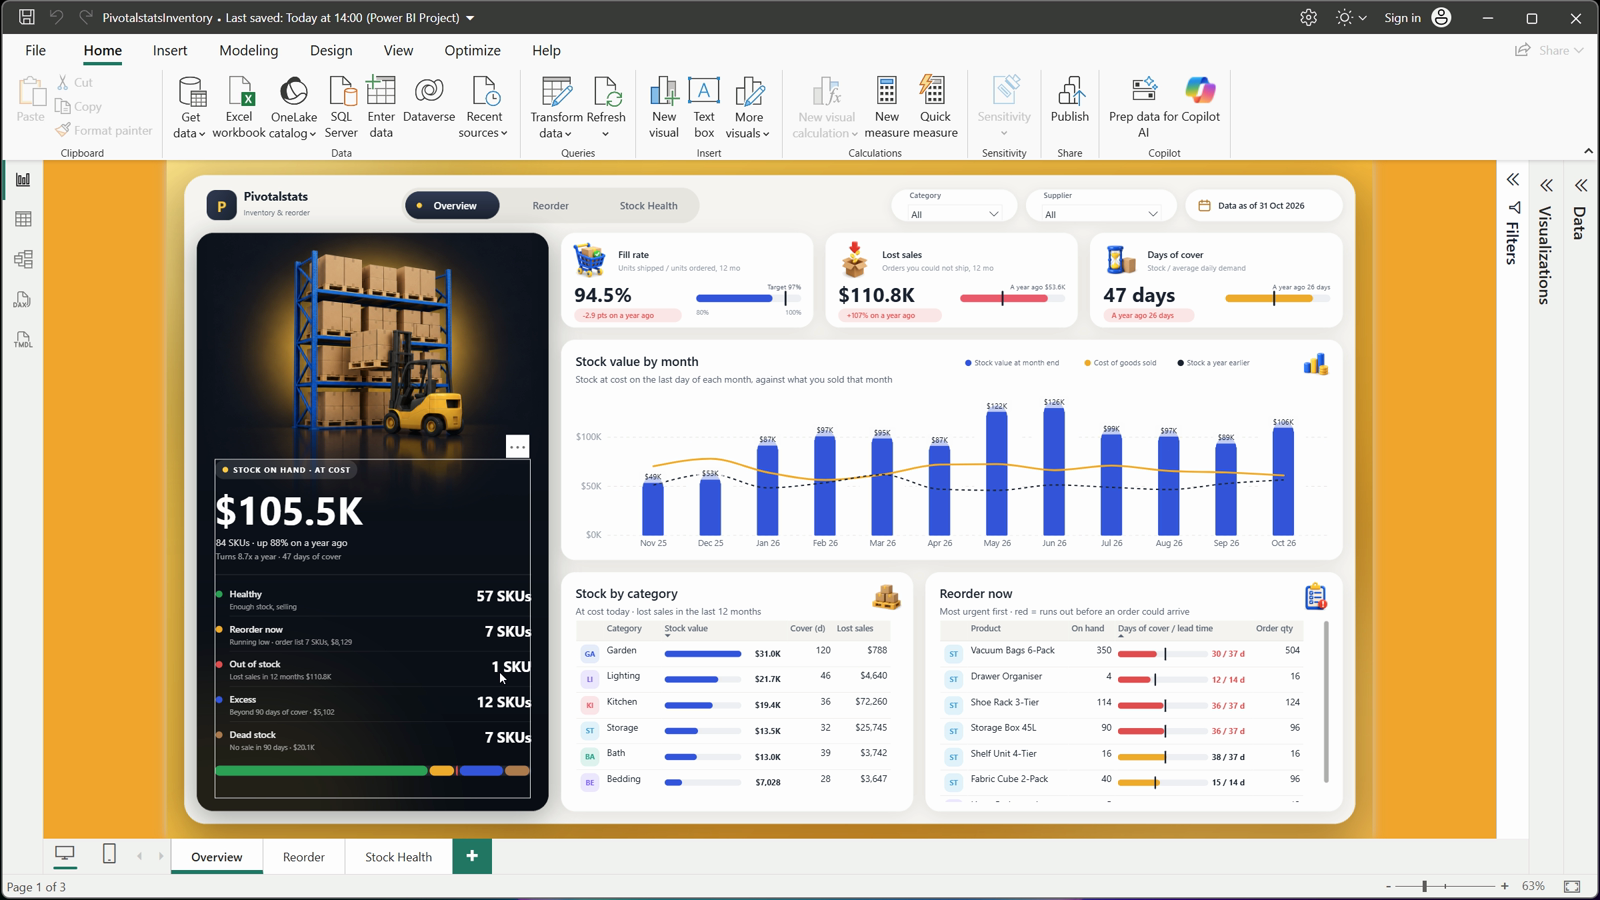
Out of stock 2 > 1
Wrap-up
You’ve now built a complete inventory and reorder dashboard: forgiving Power Query steps for sales and purchase logs, one table of stock movements, stock on hand as a running total, reorder points from each supplier’s real lead time, order quantities rounded to case packs, a supplier scorecard, an ABC analysis and an app-style design with a hero column and cards drawn by DAX.
If you’d rather start from the finished file, the ready-made template includes the dashboard, the Excel workbook and a step-by-step setup guide.
Prefer the ready-made template? Get Inventory & Reorder for $19, with the dashboard, the Excel file and a step-by-step guide: Click to Buy
More dashboards: https://www.youtube.com/@PivotalstatsProjects · https://pivotalstats.com