DAX or Data Analysis Expression is a concept that you should learn if you aspire to get the most out of Power BI capabilities or want to master it. These are a set of functions & operators which helps a user create new information out of existing data or analyze critical KPI’s.
If you are wondering how, then don’t worry I will take you through the basics of DAX & then dive deeper into more advanced DAX functions which you can use for Data Analytics needs. So let’s get started!
How do we structure DAX?
Similar to how we write Excel functions, DAX also has predefined functions & operators which are clubbed together or used individually to create your final DAX formula.
Below is an example of a DAX function which sums two columns separately and then divide them to get the final result
=SUM(Column1) / SUM(Column2)
Here we have used the “SUM” function with the division operator “/” to get the final result
What are the different Operators used in DAX?

We will get to know these operators more in detail when we will start creating our own DAX formula
Where can we use DAX?
There are 2 ways we can use a DAX
Calculated Columns :
When you want your calculations to be done on a row level basis then we enter DAX into a Calculated Column. Let me explain this with an example.
Requirement
Create a new column which will show the Revenue for each row in the data using the Price_USD & Sales column
So in this case, since we need to calculate the Revenue for each row separately and store it inside a table physically, we will create a Calculated Column. Usually while creating a calculated column, I prefer creating it from the Data view because it gives us a visual preview of the data. However there are other ways as well which are listed below:
- After importing the dataset into Power BI
- Option 1 : Click on the 3 dots icon in the fields pane besides the Table name & click on Create

- Option 2 : Or click on the New Column option in the Modelling tab

- Preferred Option : Or the preferred way is to go to Data view by clicking on Data View button

- Now right click anywhere on the table where you want to create the column and click “New Column”
- And in the formula bar enter below formula
Revenue = PizzaSales[Price_USD] * PizzaSales[Sales]

Calculated Measures :
When you want to do the calculation on an aggregated level and don’t particularly want to store information on the row level basis. In comparison to Columns, measures don’t create physical values in your table, hence do not increase file size.
Requirement
The pizza shop ran a 15% discount on each pizza, so calculate the final revenue for all pizza sold using Price_USD, Sales & Discount%
Now in case we can create a Calculated Measure because we don’t want to store the values physically for each row
- For measures I prefer to use Report view only, so click on the 3 dots icon besides the table name in Fields section and click on New Measure


- And now in the Formula bar enter the formula below. Give any name as per your choosing, for now I have used “RevDiscounted”
RevDiscounted = SUMX(PizzaSales, ((PizzaSales[Price_USD] * PizzaSales[Sales]) * 0.15))
Now if you have observed, since Calculated Measures are created on an aggregated level, you have to encapsulate your column name inside an aggregation function like we used SUMX in this case.
Implicit Measures vs. Explicit Measures
Now finally just a concept to keep in mind. By default when you drag a column into the report layout, Power BI automatically creates an aggregation measure which is known as Implicit Measure. Like in below case when I dragged Sales column to the Y axis to create a chart, it automatically applied a SUM aggregation on the column to give me a grouped value for every Pizza Name

On the other hand, Explicit Measures are the measures which we create by entering a custom formula in the formula bar like we did earlier while calculating Revenue & RevDiscounted.
Both types of measures serve their own purpose but Explicit measures are much more flexible and help in building complex logic for custom analysis on metrics & KPI’s.
Lets now see how to use DAX and explore multiple categories or family of DAX used in Data Analytics. This will not be an exhaustive list of DAX functions but I have tried to cover all functions which are the most important ones in each category of DAX functions.
Refer to the below link for the complete list of DAX available
https://learn.microsoft.com/en-us/dax/dax-function-reference
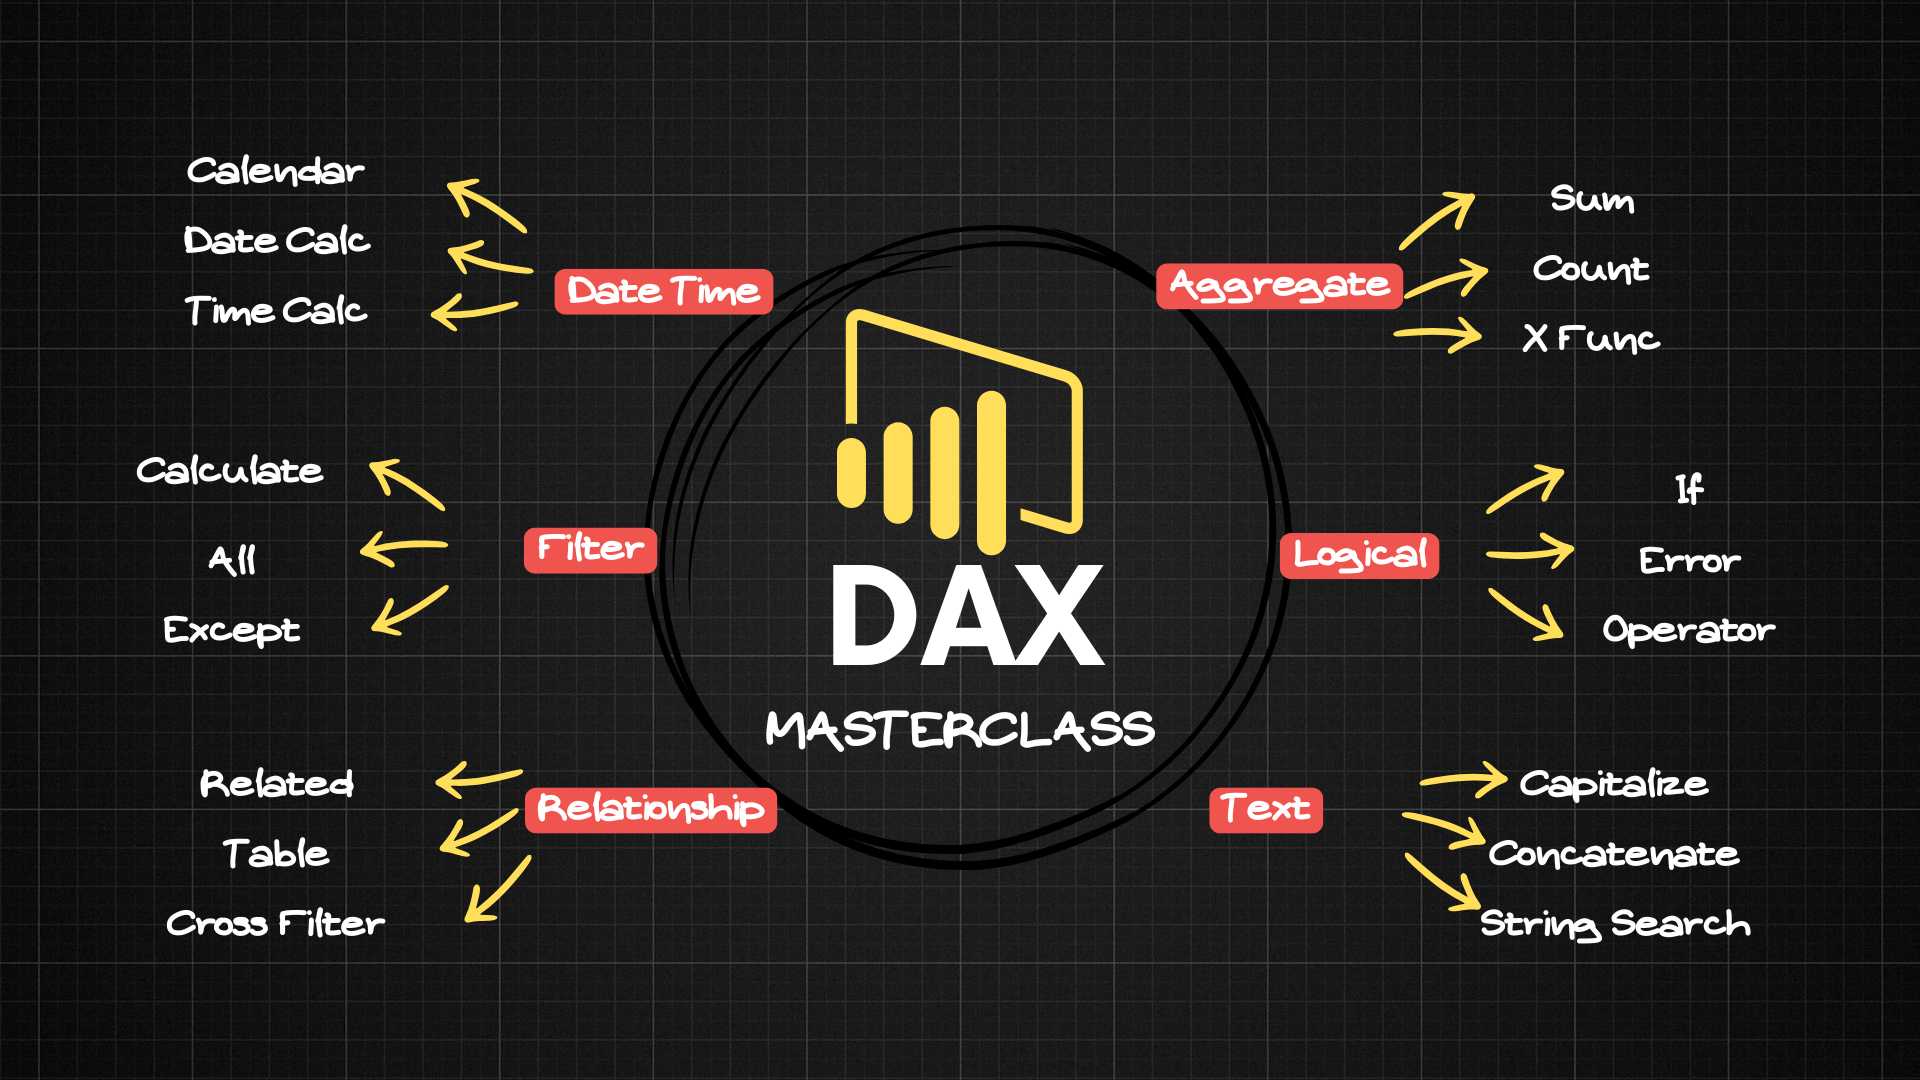
List of DAX Categories we will cover in below video:
a) Date Time DAX functions
b) Aggregate DAX functions
c) Logical DAX functions
d) Text DAX functions
e) Relationship DAX functions
f) Filter DAX functions
That’s it, please comment and let me know if you want me to cover any other DAX function. I will try to cover that topic as soon as possible. Thanks for reading, see you in the next one!