
A data model is essentially a structured representation of your data, which can be used to facilitate analysis and reporting. In Power BI, you can use data models to create interactive reports & visualization that allow you to explore the data in a variety of ways.
Today we will cover the entire data modeling concept in Power BI, including Data Normalization, Fact/Dimension structure, Types of Data Model & Cardinality. We will also discuss topics such as Relationships and Filter directions, and how to use these to create more powerful and sophisticated data models. So let’s get started!
What is Data Normalization
Before we get into data models, it’s crucial to understand Data Normalization because it is a mandatory precursor for creating a data model.
So to explain it in simple terms, it is a process of splitting the database into multiple tables so that we can reduce redundancy and improve data integrity. Let me explain this with an example
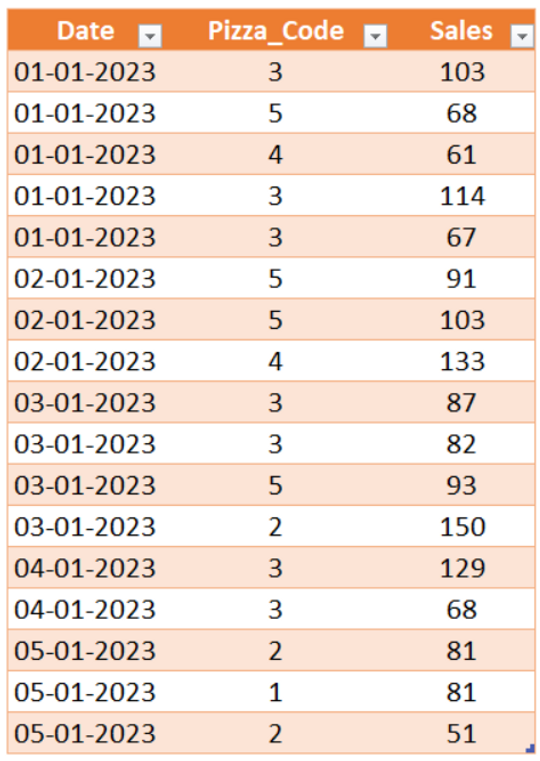
Below table contains the data of Pizza sales in Joy Pizza’s from 1st Jan – 5th Jan 2023.

At first glance the data might seem perfect to you for use in your reports or visualization. But if you observe closely, it contains a lot of redundant data which needs to be normalized. And if you ignore this step then when data gets bigger, lets say 10 million records, then it will create a lot of inefficiency & lag. Also working on any kind of analysis on such a huge data set will be a nightmare.
So How to Normalize?
Here comes the concept of splitting the database into Fact & Dimensions tables. Fact tables typically contain measurable or quantitative fields and Dimension tables contain unique categorical columns which are attributes of the Quantitative fields.
To understand this better we will use the same Pizza sales data and will split it into Fact & Dimensions
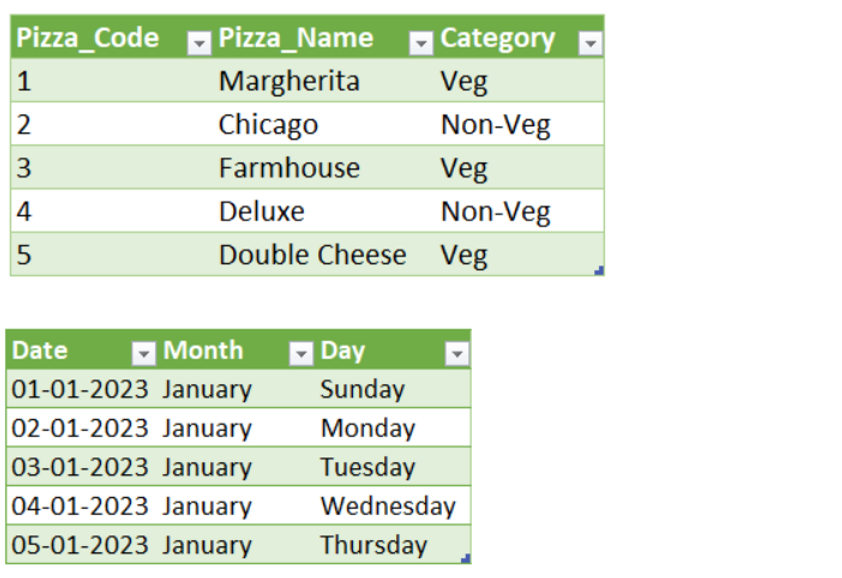
Fact Table
In this I have taken all measurable values in one table which may contain duplicate entries of any particular column like Date but all row items serves a single purpose of providing sales value of a pizza in a given date
Dimension tables
Now I have splitted all the redundant categorical values in a separate table and which are now unique. Dimension tables should be unique in nature and should also contain a linking column which will be used to connect to the Fact table when we build the data model. In database and modeling terms, this concept is known as Primary & Foreign Key. We will explore these concepts much more in detail going forward.
Let’s start building our Data Model
Now let’s import our Fact & Dimension tables into power bi. (In case you need detailed content on Data Import then you can refer to my previous blog on the same subject)
- Open Power BI Desktop
- Go to Get Data >> Excel Workbook
- Select the file from the browse menu & import Fact table & Dimension tables
- After importing data, click on the Modeling tab of Power BI

You will see something like below

Sometimes Power BI auto detects relationships between tables & creates connections. So you may choose to keep them or remove them as per your requirements. But for now we will start from scratch so that I can explain each and every concept
Right now these are isolated tables which do not have any kind of connection between them, so even if you use these tables together in report view, you will get an error


Creating Relationships
So now to create relationships in your data model
- Go back to the Model view
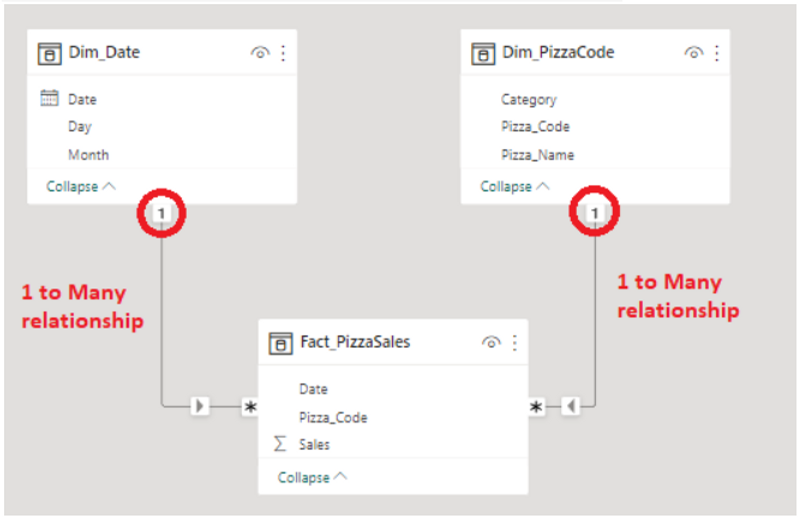
- Click on the Foreign key i.e. the key in the Fact table which has multiple entries for date / Pizza code and drop it on the Primary key of the Dimension table

Now you have successfully created a 1-Many relationship between Dimension table & Fact table. This is called CARDINALITY, and it is advisable to always create a 1-Many relationship. If you try to create a Many-Many relationship i.e. both tables have multiple entries of the same value then this might create problems. So be very cautious if you decide to use Many-Many relationships, as this might have weird behavior on your model.
Let’s see how this has impacted our Report View grid which we created earlier

As you see now all values are fetching correctly and we have successfully implemented our data model into the reporting view.
Types of Model Schema
So typically while creating a data model, you will come across below 2 model schema’s
STAR SCHEMA
This type of schema is formed like a star and hence the name. There would be a central Fact table which is connected to multiple Dimension Tables. Similar to what we have created above

SNOWFLAKE SCHEMA
Then you also have snowflake which is an extension from a star schema, where each or few dimension tables have more sub attribute tables branching out of it

Both of the SCHEMA have their own purpose and its usage is completely dependent on your requirements.
So now let’s see an example of SNOWFLAKE SCHEMA in our data. So now in addition to the existing dataset, we have an additional subcategory table which has the ingredients of Veg & Non-Veg pizza

We cannot establish a direct relationship between this subcategory dimension table and the fact table, so we will have to rely on a SNOWFLAKE SCHEMA and join Dim_Pizzacode with this table like below:
- Import the new data into Power BI
- Go to the Model view and then join Dim_PizzaCode with Dim_SubCategory


Cross Filter Direction
Now the final topic for today is Cross Filter Direction. You must have noticed by now that while creating a relationship between 2 tables, Power BI indicates the relationship flow with a small arrow

This is a very important topic to understand, since this has a direct impact on the visualization that you create in your view. The flow of the filter is always from the Primary Key (dimension table) to Foreign Key (fact table). So how does this matter?
Let us understand this by loading a 2nd Fact table in our model, which is amount of Pizza’s which are Unsold at the end of the day

Now let’s join the table with Dimension tables similar to Fact_PizzaSales

Going back to the Report view, if I drag Date from Sales table instead of the Dimension table then it will give me below result, which is wrong

This is because the flow of the filter is from the Dimension to the Sales Fact table and not the other way round, so when we drag a column from the Sales table, Power BI does not know what to do with the column from the Unsold fact table.
Same goes if we drag the Date column from the Unsold Fact table

Both Way Filter Direction
Now doing is not recommended , since this might have unforeseen behavior in your data model. But just in case you still wanted a 2 way filter here, then below is what you should do
- Go to Model view
- Double click on the connection line to go the Edit Relationship prompt

- Open the dropdown in Cross Filter Direction section and select “Both” & press Ok

- But if you do this with the “Fact_PizzaUnsold” then the result might seem to be correct but if you look closely, it is missing data. I.e. there is no data for 2nd Jan. This is because PizzaUnsold did not have any value for 2nd Jan, so the final data is automatically filtered

So instead of Fact_PizzaUnsold, apply 2-Way filter on Fact_PizzaSales and you will see the correct results now

But as mentioned above, try to use 1 way filter direction whenever possible to avoid such data discrepancies and confusions.